This idea is a continuation of "BTC long term new cycle 1D".
Please check this idea out as well: https://www.tradingview.com/chart/BTCUSDT/eaBZpDSp-BTC-long-term-new-cycle-1D/
Key points:
Summary:
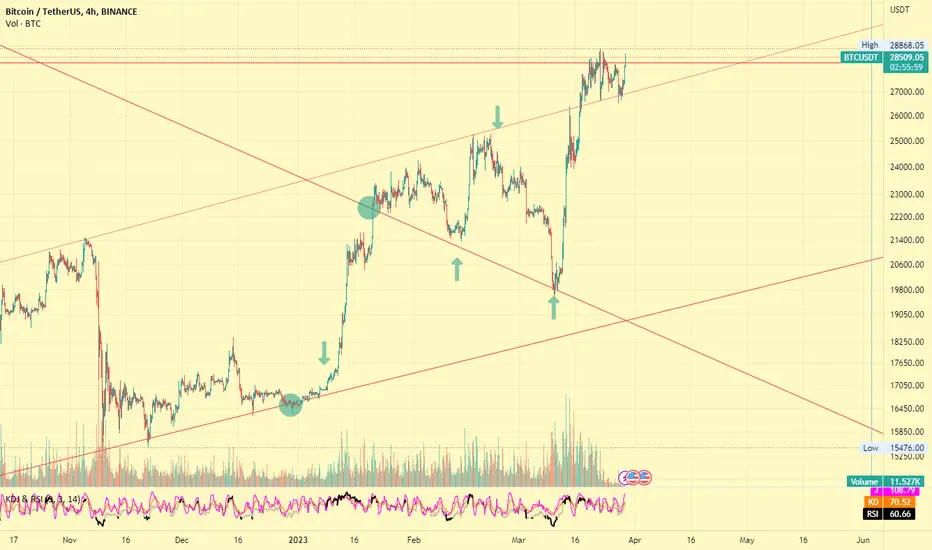
Green arrows are my buy/sell orders and i'm very happy with the results.
If the upper red line becomes new support, we will be seeing 28K+!
If we fall under, expect to drop until the lower red line super support: 20K-28K range.
Note that this line is in an uptrend, thus new highs are inevitable. With this information, the sentiment is to go long (for the very long term).
Take note that it is a possibility that it will fall starting from here, since there is possibly a bigger parent ascending triangle forming that can span until next year.
Since I bought early, I will not do anything at the moment.
Don't forget to do your own research.
Please support this idea if you liked it :)
And always be careful <3
Please check this idea out as well: https://www.tradingview.com/chart/BTCUSDT/eaBZpDSp-BTC-long-term-new-cycle-1D/
Key points:
- Lower red line is support line dating back 2011!
- Upper red line is resistance line dating back Oct 2021
Summary:
- BTC trading on the upper range of the resistance line dating back Oct 2021.
- It is currently moving in an (ugly) ascending triangle. Be careful here, although you see an ascending triangle, it's not proper, thus it is not a strong signal
Green arrows are my buy/sell orders and i'm very happy with the results.
If the upper red line becomes new support, we will be seeing 28K+!
If we fall under, expect to drop until the lower red line super support: 20K-28K range.
Note that this line is in an uptrend, thus new highs are inevitable. With this information, the sentiment is to go long (for the very long term).
Take note that it is a possibility that it will fall starting from here, since there is possibly a bigger parent ascending triangle forming that can span until next year.
Since I bought early, I will not do anything at the moment.
Don't forget to do your own research.
Please support this idea if you liked it :)
And always be careful <3
Note
Good to see that this trend of March is still accurate :). BTC and co starting to show bullish signs. However, we can still expect sideways movement on larger scale, which translates to movements between 25-31K. I will add long term investments everythink <28K. I see resistances at 28K, 30.2K, 31.8K. The coming months will be interesting. Worst case scenario is that BTC will break out (upwards) in February.Note
BTC has been trying to move up and is failing to do so. It has been hitting the 38K resistance too many times. There is nowhere to support on anymore and it might start falling from here.If we purely focus on Elliot waves, we are about to finish wave 1 of this bull cycle. This means that it will start progressing to wave 2, a motive (bearish) wave. Furthermore, BTC is out of moves on lower scales (wave 5 / A,B,C). Another indicator here would be that the volume has been dropping more and more.
If you compare Elliot wave 1 of the previous bull cycle, you will see that it has the same length as the current wave 1. Be careful here!
Related publications
Disclaimer
The information and publications are not meant to be, and do not constitute, financial, investment, trading, or other types of advice or recommendations supplied or endorsed by TradingView. Read more in the Terms of Use.
Related publications
Disclaimer
The information and publications are not meant to be, and do not constitute, financial, investment, trading, or other types of advice or recommendations supplied or endorsed by TradingView. Read more in the Terms of Use.