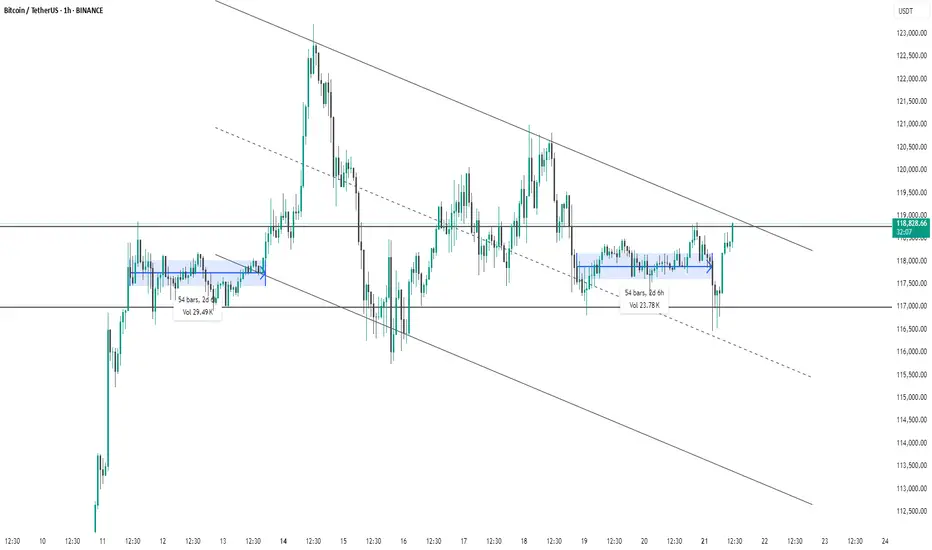
This 1-hour chart of Bitcoin/USDT (Binance) shows a descending channel pattern with clearly defined upper and lower trendlines. Price has recently broken out of a consolidation zone (highlighted in blue) and is now testing the upper boundary of the descending channel near $119,000. The breakout from the recent range (lasting 54 bars / 2d 6h with 23.78K volume) suggests bullish momentum. However, for confirmation of trend reversal, a strong breakout above the channel is needed. Until then, the broader downtrend structure remains intact.
thanking you
thanking you
Related publications
Disclaimer
The information and publications are not meant to be, and do not constitute, financial, investment, trading, or other types of advice or recommendations supplied or endorsed by TradingView. Read more in the Terms of Use.
Related publications
Disclaimer
The information and publications are not meant to be, and do not constitute, financial, investment, trading, or other types of advice or recommendations supplied or endorsed by TradingView. Read more in the Terms of Use.