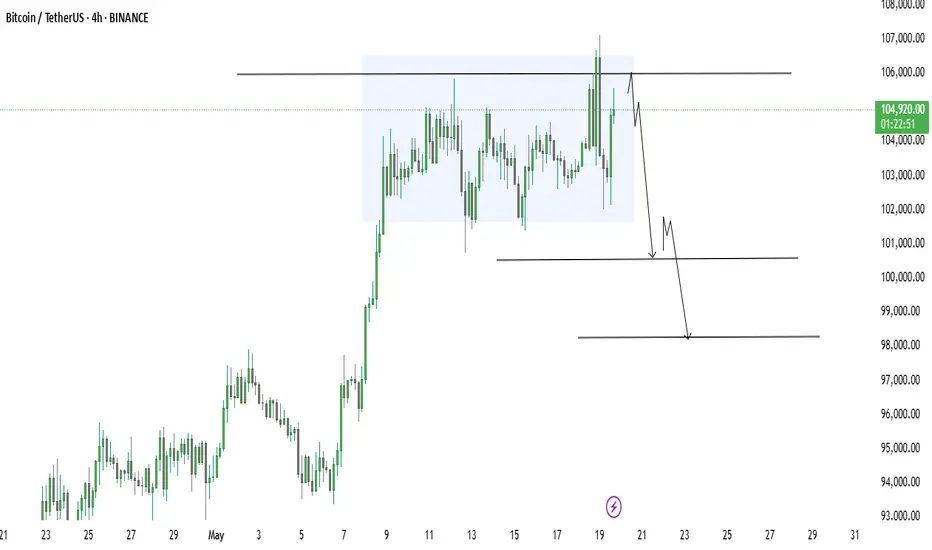
Bitcoin price will seems to selling side Clear in the chart lets see
Sideways (Range-bound) Trading: This usually shows market indecision. Buyers and sellers are in balance At or Near Resistance: If price keeps testing resistance without breaking it, sellers may start dominating..
If resistance holds and there's a bearish catalyst (like macro news, ETF outflows, or regulatory fear), Bitcoin could drop toward support levels if the price stay in downside then next target would be 100.500 and 98,300
You may find more details in the chart pls support with like and comments for more better analysis Thanks for Support.
Join My telegram Channel
t.me/FOREX_FREE_SIGNALS_1
Free Forex Signals
t.me/Jamessignals11
t.me/FOREX_FREE_SIGNALS_1
Free Forex Signals
t.me/Jamessignals11
Related publications
Disclaimer
The information and publications are not meant to be, and do not constitute, financial, investment, trading, or other types of advice or recommendations supplied or endorsed by TradingView. Read more in the Terms of Use.