Hi traders,
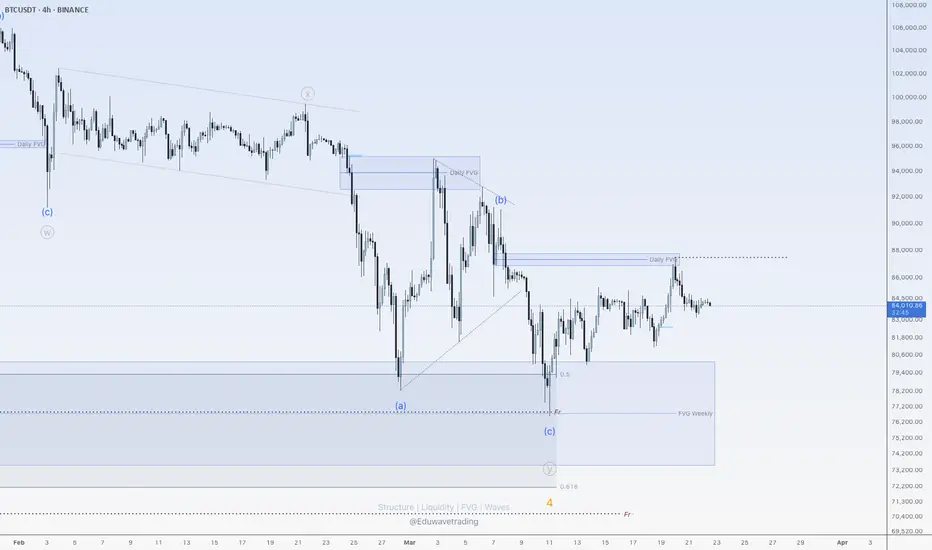
Last week I've said in my outlook for Bitcoin that it could be making a leading diagonal (wave 1) or we could see another move down (ending diagonal blue wave c).
This analysis still applies.
If price can close above the dotted trendline, it's bullish again.
So let's see what the market does and react.
Trade idea: Wait for a close above the dotted trendline, an impulsive wave up and a small correction down to trade longs.
If you want to learn more about trading FVG's & liquidity with wave analysis, please make sure to follow me.
This shared post is only my point of view on what could be the next move in this pair based on my analysis.
Don't be emotional, just trade your plan!
Eduwave
🆓 Check my IG posts for free education
💯 Learn to trade my plan based on FVG's and wave analysis with my e-book, inclusive in my VIP Discord: eduwavetrading.gumroad.com/l/vipdiscord
🔥 Other (free) products: eduwavetrading.gumroad.com
💯 Learn to trade my plan based on FVG's and wave analysis with my e-book, inclusive in my VIP Discord: eduwavetrading.gumroad.com/l/vipdiscord
🔥 Other (free) products: eduwavetrading.gumroad.com
Disclaimer
The information and publications are not meant to be, and do not constitute, financial, investment, trading, or other types of advice or recommendations supplied or endorsed by TradingView. Read more in the Terms of Use.