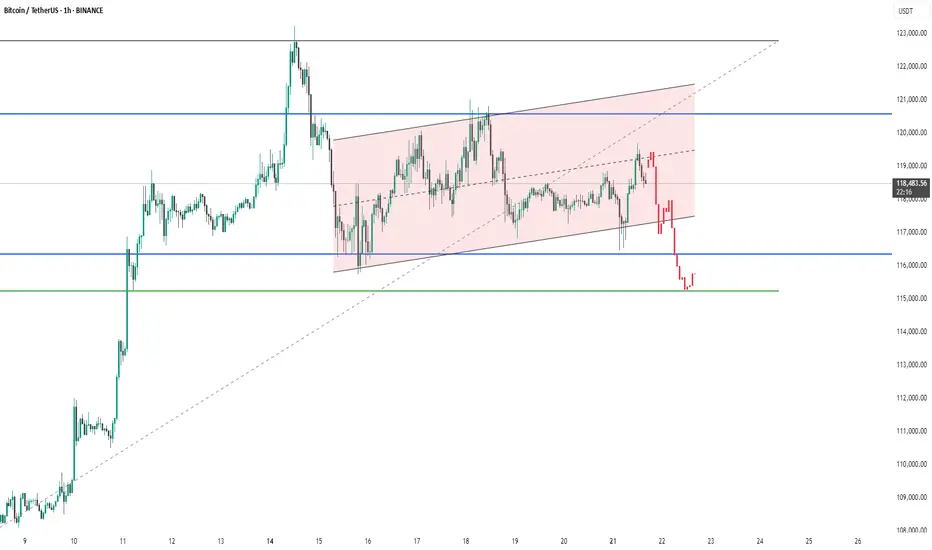
The chart shows Bitcoin (BTC/USDT) on a 1-hour timeframe experiencing a breakdown from an ascending channel (highlighted in pink). After reaching resistance near $120,800, price sharply declined, breaking below both the channel support and the key horizontal support around $117,000 (blue line). It is now testing the next support zone around $115,000 (green line). This suggests strong bearish momentum, and if $115K fails to hold, further downside could be expected.
Related publications
Disclaimer
The information and publications are not meant to be, and do not constitute, financial, investment, trading, or other types of advice or recommendations supplied or endorsed by TradingView. Read more in the Terms of Use.
Related publications
Disclaimer
The information and publications are not meant to be, and do not constitute, financial, investment, trading, or other types of advice or recommendations supplied or endorsed by TradingView. Read more in the Terms of Use.