Hi there,
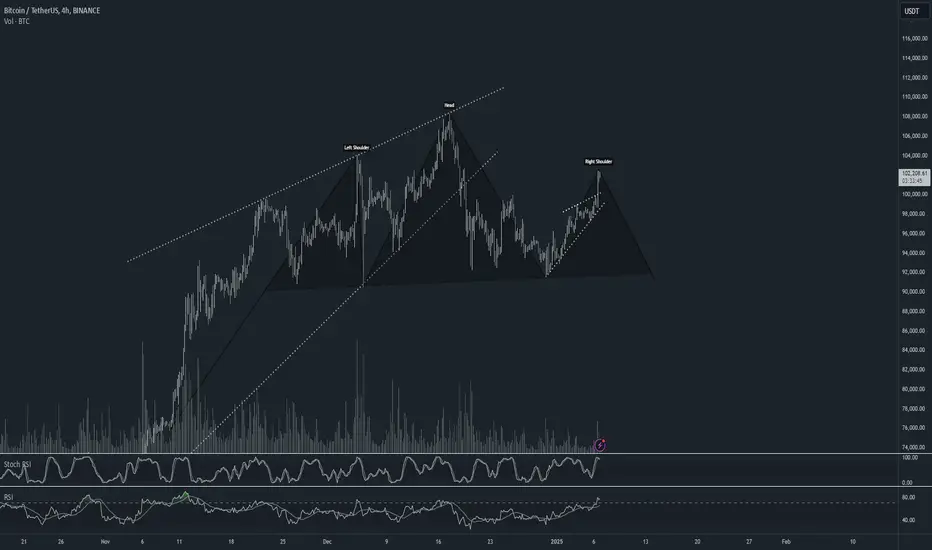
Price appears to be forming a H&S on the 4H timeframe. The pattern also seems to be forming on higher timeframes these include; 3H, 6H, 8H, 12H, 16H.
I could be wrong but zoom out and look for yourself. If this resistance fails to hold we could see this pattern be continued. If it breaks below the neckline the pattern will be confirmed and we can expect BTC to return to the $85,000 mark.
Any input/insight into this idea would be greatly appreciated, thank you! :)
Disclaimer
The information and publications are not meant to be, and do not constitute, financial, investment, trading, or other types of advice or recommendations supplied or endorsed by TradingView. Read more in the Terms of Use.
Disclaimer
The information and publications are not meant to be, and do not constitute, financial, investment, trading, or other types of advice or recommendations supplied or endorsed by TradingView. Read more in the Terms of Use.