#BTCUSDT Update! 🚀
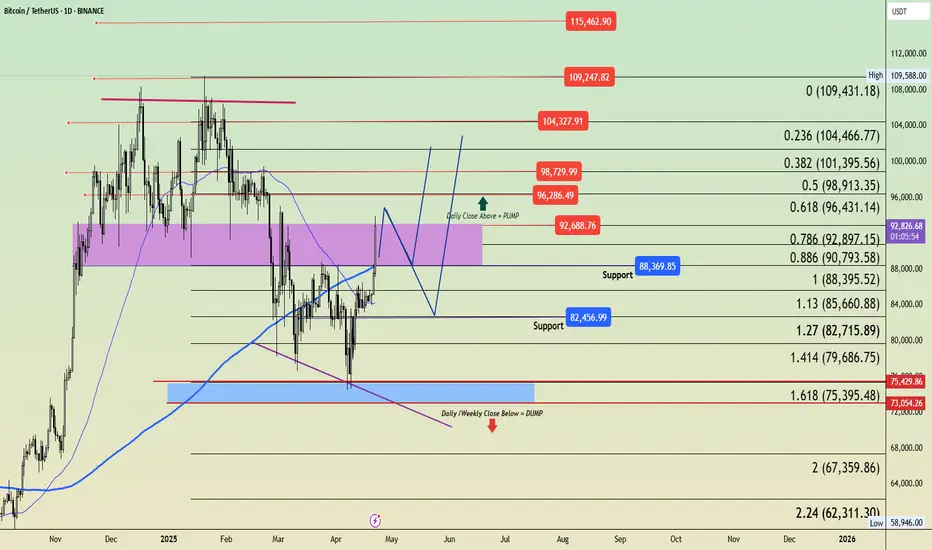
Bulls have delivered strong momentum, breaking above the 88K zone and pushing up to $93K — a move we haven’t seen since early 2025. That’s a massive +10% daily candle on BTC, a clear sign of market strength.
Meanwhile, gold faced a sharp rejection from its ATH, dropping nearly $200 from $3500 to $3325 on the daily chart. This highlights a shift in liquidity and profit-taking—BTC is clearly the beneficiary. BITCOIN🔥
🔍 BTC Technical Breakdown:
BTC has now broken out above the daily resistance zone, including the 200-day MA, and is hovering just below the mid-term key area of 92K–$93K.
This range previously served as solid support for nearly 90 days, from Nov 25, 2024, to Feb 25, 2025.
➡️ The Real Test Now:
Can the bulls flip this zone into support and drive us toward new ATHs?
The next few days will tell.
📌 My Personal Bias:
If momentum continues, I expect BTC to stall between $93K–$97K.
A pullback to88K would be a healthy retest of broken resistance.
If bulls hold that level, we could see a clean breakout continuation.
If not, BTC may revisit the $84K–$81K range before mounting another attempt upward.
This movement aligns with the Plan A I’ve followed since February and confirms our broader strategy:
Chart PLAN A&B Below!

💬 If you’re wondering what I’m doing right now…
You might ask:
✅ Should I keep my investment?
✅ Should I book some profits?
✅ Should I open a new position?
Here’s what I did:
My team and I secured half of our profits around 87K–88K, and some between $91K–$93K.
We’re holding the rest and ready to buy again on any retrace—if price plays out as expected.
It’s part of our proven strategy: Secure profits, stay exposed, and prepare for the next wave.
📢 Public Trades Update:
🔹 Entry Avg: $79K - $78K
✅ Sold 25% at $85K
✅ Sold another 25% at $92,7XX
🟢 Still holding 50%
🔹 Entry Avg: $79,900 - $77,500
✅ Sold 35% at $81K
✅ Sold another 35% at $92,7XX
🟢 Holding the rest
📌 Short-term traders: Use tight SLs and focus on solid levels.
📌 Long-term investors: (This part is done).
💡 If you ignored our updates from $103K - 98K and got stuck at the top, it's only a matter of time before the market pumps again—just ensure you can benefit from movements & dips
⚠️ Risk Management & Altcoins
🔸 Altcoins are still highly reactive to BTC’s retracements.
🔸 Stick to the plan, don’t trade emotionally, and keep FIAT ready.
📌 Final Thoughts – Stay Disciplined!
✅ Don’t FOMO if you missed our buy levels—we shared them early.
✅ Don’t chase resistance—wait for clear confirmation.
🔹 Execute smart, protect your capital, and stay patient.
Please keep in mind that this is not financial advice and the purpose of these charts is to provide an idea of coin movement, not buy or sell signals. The cryptocurrency market is highly volatile and not suitable for everyone, so be aware of the potential risks before making any investment decisions. The information presented here is a personal effort and is subject to success or failure, and we welcome constructive criticism.
Good luck to all.
🙏we ask Allah reconcile and repay🙏
Bulls have delivered strong momentum, breaking above the
Meanwhile, gold faced a sharp rejection from its ATH, dropping nearly $200 from $3500 to $3325 on the daily chart. This highlights a shift in liquidity and profit-taking—BTC is clearly the beneficiary. BITCOIN🔥
🔍 BTC Technical Breakdown:
BTC has now broken out above the daily resistance zone, including the 200-day MA, and is hovering just below the mid-term key area of
This range previously served as solid support for nearly 90 days, from Nov 25, 2024, to Feb 25, 2025.
➡️ The Real Test Now:
Can the bulls flip this zone into support and drive us toward new ATHs?
The next few days will tell.
📌 My Personal Bias:
If momentum continues, I expect BTC to stall between $93K–$97K.
A pullback to
If bulls hold that level, we could see a clean breakout continuation.
If not, BTC may revisit the $84K–$81K range before mounting another attempt upward.
This movement aligns with the Plan A I’ve followed since February and confirms our broader strategy:
Chart PLAN A&B Below!
💬 If you’re wondering what I’m doing right now…
You might ask:
✅ Should I keep my investment?
✅ Should I book some profits?
✅ Should I open a new position?
Here’s what I did:
My team and I secured half of our profits around
We’re holding the rest and ready to buy again on any retrace—if price plays out as expected.
It’s part of our proven strategy: Secure profits, stay exposed, and prepare for the next wave.
📢 Public Trades Update:
🔹 Entry Avg: $79K - $78K
✅ Sold 25% at $85K
✅ Sold another 25% at $92,7XX
🟢 Still holding 50%
🔹 Entry Avg: $79,900 - $77,500
✅ Sold 35% at $81K
✅ Sold another 35% at $92,7XX
🟢 Holding the rest
📌 Short-term traders: Use tight SLs and focus on solid levels.
📌 Long-term investors: (This part is done).
💡 If you ignored our updates from $103K -
⚠️ Risk Management & Altcoins
🔸 Altcoins are still highly reactive to BTC’s retracements.
🔸 Stick to the plan, don’t trade emotionally, and keep FIAT ready.
📌 Final Thoughts – Stay Disciplined!
✅ Don’t FOMO if you missed our buy levels—we shared them early.
✅ Don’t chase resistance—wait for clear confirmation.
🔹 Execute smart, protect your capital, and stay patient.
Please keep in mind that this is not financial advice and the purpose of these charts is to provide an idea of coin movement, not buy or sell signals. The cryptocurrency market is highly volatile and not suitable for everyone, so be aware of the potential risks before making any investment decisions. The information presented here is a personal effort and is subject to success or failure, and we welcome constructive criticism.
Good luck to all.
🙏we ask Allah reconcile and repay🙏
Note
Daily performance Not the perfect candle on the daily timeframe,e be careful, guys, and stick with risk management!
🙏we ask Allah reconcile and repay🙏
Note
Ah, my mistake, forgot to keep you posted! #BTCUSDT – Market Update
BTC ended its breakout from
Weekly close wasn’t strong, but bulls are still holding $93K, which is a key barrier above the
Wednesday's movement and the upcoming FED rate decision may play a critical role in shaping the next leg
From the bull side, $100K remains the key resistance in this short-term move. A confirmed breakout and close above it could push BTC to $105K–$107K, possibly leading to a new ATH level around $117K
Until then, we stick with the current short-term view of a retracement to
We're watching the performance closely and still holding the positions shown below. If you're trading here, holding $93K with a tight SL is valid, though personally I prefer waiting since BTC is still below solid resistance
On the long-term side, BTC continues to follow Plan A holding the MA 50 support. The broader plan remains intact with no major changes so far
(
Long-Term Chart Update
In this chart, after RSI rebounded and price held above the MA 50 around $51K, we saw a series of fast retracements (marked with red arrows). Each time, the trend continued upward until we reached $109K.
Since February 2025, I’ve been tracking and sharing these patterns clearly — every move we’ve made has been part of a structured plan based on this setup.
The recent pullback I took and explained also came from the same chart and same fractals. However, this time we’re seeing something different:
RSI and price have both gone flat with no clean pullback or resting phase yet.
So everything I’ve posted comes from a clear chart-based view, not random decisions.
We’ve successfully avoided getting stuck at ATH, and we’ve traded dips wisely.
And just to be clear — if you're expecting me to say "go all in," I won’t.
You’ll wait a long time for that.
We’ve secured solid entries on BTC, both here and on WildBITCOIN. The only minor adjustment — though we still did well — was tweaking one of the buy levels to a lower zone for more precise DCA.
Some people adjusted their TPs for more profit. I adjusted the entry — and yeah, it was off by about $3K, but we corrected that and got the fill.
You can’t avoid every slip — perfection is nearly impossible — but for me personally, I’m satisfied with how we’ve performed overall.
BTC reclaims $100K!
We’re still holding these position — no new update yet! ✔️👆
📢 Public Trades Update (No Change)
✅ Entry Avg: $79K – $78K
• Sold 25% at $85K
• Sold another 25% at $92.7K
• Holding 50%
✅ Entry Avg: $79,900 – $77,500
• Sold 35% at $81K
• Sold another 35% at $92.7K
• Still holding the remaining position
Why the $100K Weekly Close Matters For Plan A ATH?
The chart speaks for itself — no hype, no guesswork. Just clear structure:
🔼 On the upside:
First weekly close above $100K, BTC pushed to $108K
Second time, it reached $109K
🔽 On the downside:
First close below $100K, BTC dropped to
Second close below $100K, it went straight to $75K
So it’s clear — $100K is a magnet level 🧲
It acts as a psychological and technical pivot, and how BTC closes around it on the weekly frame defines the next major leg.
🙏we ask Allah reconcile and repay🙏
👋 Be a trader, not a gambler, by following risk/capital management!!
🎉Get Your Discount Today! (Limited offer)
t.me/PCS_Signals_Results/6922
We ask Allah reconcile and repay ❤️🙏
🎉Get Your Discount Today! (Limited offer)
t.me/PCS_Signals_Results/6922
We ask Allah reconcile and repay ❤️🙏
Disclaimer
The information and publications are not meant to be, and do not constitute, financial, investment, trading, or other types of advice or recommendations supplied or endorsed by TradingView. Read more in the Terms of Use.