Below is a structured, step-by-step technical analysis of the shared BTC/USDT chart (on a 30-minute timeframe) along with a possible short-term (next 12 hours) outlook. Please note this is not financial advice but rather a technical perspective for informational purposes.
1. Identify the Overall Context
Timeframe: The chart is set to the 30-minute interval, indicating short-term price action and intraday volatility.
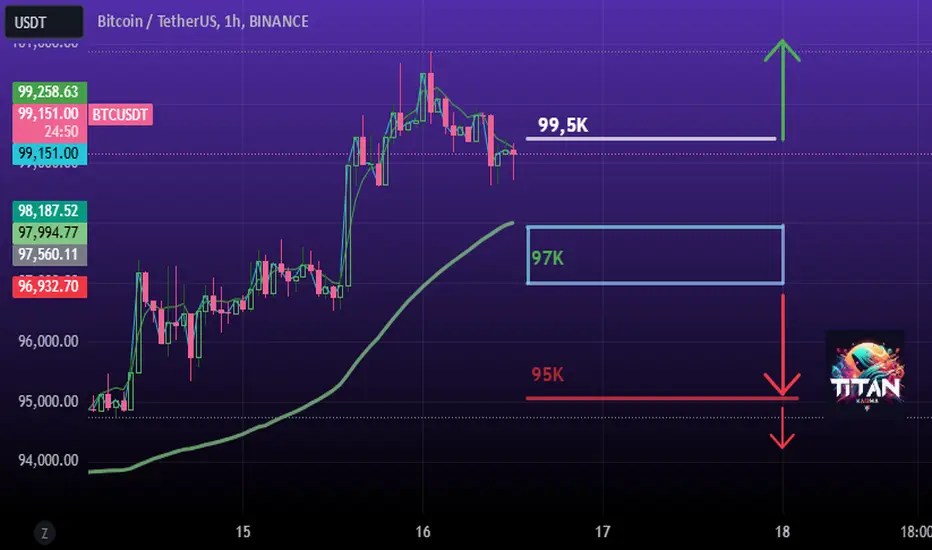
Current Price Region: BTC appears to be trading in the mid/upper 98,000 range (as shown on the screenshot).
Recent Movement: Price fell sharply from around 102,000–103,000 down to approximately 97,000, and then recovered slightly to the 98,000–99,000 zone.
2. Key Indicators Visible
Bollinger Bands (Purple Area)
Bands are relatively wide, suggesting increased volatility.
Price is near or below the middle band, indicating slight bearish pressure in the short term.
Moving Averages
There appear to be at least two commonly used MAs:
A shorter-term MA (possibly 50-period) in yellow/orange.
A longer-term MA (possibly 200-period) in blue.
The price has fallen below the shorter-term MA, which can be a short-term bearish signal.
The price is hovering around or slightly under the longer-term MA (the 200 MA in blue), which typically acts as a stronger support or resistance.
Volume Profile (SVP HD Up/Down)
Shows volume-by-price bars on the right side.
Notable high-volume nodes around 99,000–100,000, suggesting a strong interest level where price may consolidate or reverse.
Another cluster of volume near 97,000, possibly acting as short-term support if price revisits that zone.
Volume Bars (Below the Chart)
A significant spike in volume during the sharp move downward from ~102,000 to ~97,000.
Post-drop volume appears moderate, suggesting some stabilization but not an aggressive recovery.
3. Short-Term Momentum Evaluation
Price Action Relative to Moving Averages
Trading below the 50-period MA often indicates short-term weakness.
If the price fails to reclaim the 50 MA, the market may remain under bearish pressure for the next few candles (each candle = 30 minutes).
Bollinger Band Position
If candles close near or below the lower Bollinger Band, oversold bounces are likely but not guaranteed.
If candles remain compressed below the midpoint of the bands, it tends to confirm near-term bearish or sideways sentiment.
Possible Divergence Signals
Without direct MACD/RSI data on the screenshot, we rely on the advanced divergence indicator “MIS Adv Div.” If it’s showing bullish divergence (not fully clear from the image), there could be a short-term bounce. If it’s showing bearish continuation, the downward trend may persist.
4. Support and Resistance Levels
Immediate Resistance
Around 99,000–99,500: This area aligns with the lower side of a high-volume zone and the short-term MA.
Around 100,000–101,000: A psychologically significant level and also near the previous swing highs and volume node.
Immediate Support
Around 97,000: Where price found an initial bounce on the large sell-off.
Around 95,000: The next potential zone if 97,000 breaks.
5. Short-Term (Next 12 Hours) Price Outlook
Likely Scenario (Sideways to Slight Rebound)
The price may range between 97,000 (support) and 99,500 (local resistance).
If buyers step in at 97,000 again, expect a mild recovery toward the 99,000–100,000 region.
Bullish Breakout
If BTC reclaims the 99,500–100,000 zone with strong buying volume, it could target 100,500–101,000 next.
Watch for a 30-min candle close above the 50 MA to confirm potential upside momentum.
Bearish Continuation
If price fails to hold 97,000, a deeper retracement to 95,000 or lower may occur.
Sustained trading below the 200 MA would reinforce near-term bearish momentum.
1. Identify the Overall Context
Timeframe: The chart is set to the 30-minute interval, indicating short-term price action and intraday volatility.
Current Price Region: BTC appears to be trading in the mid/upper 98,000 range (as shown on the screenshot).
Recent Movement: Price fell sharply from around 102,000–103,000 down to approximately 97,000, and then recovered slightly to the 98,000–99,000 zone.
2. Key Indicators Visible
Bollinger Bands (Purple Area)
Bands are relatively wide, suggesting increased volatility.
Price is near or below the middle band, indicating slight bearish pressure in the short term.
Moving Averages
There appear to be at least two commonly used MAs:
A shorter-term MA (possibly 50-period) in yellow/orange.
A longer-term MA (possibly 200-period) in blue.
The price has fallen below the shorter-term MA, which can be a short-term bearish signal.
The price is hovering around or slightly under the longer-term MA (the 200 MA in blue), which typically acts as a stronger support or resistance.
Volume Profile (SVP HD Up/Down)
Shows volume-by-price bars on the right side.
Notable high-volume nodes around 99,000–100,000, suggesting a strong interest level where price may consolidate or reverse.
Another cluster of volume near 97,000, possibly acting as short-term support if price revisits that zone.
Volume Bars (Below the Chart)
A significant spike in volume during the sharp move downward from ~102,000 to ~97,000.
Post-drop volume appears moderate, suggesting some stabilization but not an aggressive recovery.
3. Short-Term Momentum Evaluation
Price Action Relative to Moving Averages
Trading below the 50-period MA often indicates short-term weakness.
If the price fails to reclaim the 50 MA, the market may remain under bearish pressure for the next few candles (each candle = 30 minutes).
Bollinger Band Position
If candles close near or below the lower Bollinger Band, oversold bounces are likely but not guaranteed.
If candles remain compressed below the midpoint of the bands, it tends to confirm near-term bearish or sideways sentiment.
Possible Divergence Signals
Without direct MACD/RSI data on the screenshot, we rely on the advanced divergence indicator “MIS Adv Div.” If it’s showing bullish divergence (not fully clear from the image), there could be a short-term bounce. If it’s showing bearish continuation, the downward trend may persist.
4. Support and Resistance Levels
Immediate Resistance
Around 99,000–99,500: This area aligns with the lower side of a high-volume zone and the short-term MA.
Around 100,000–101,000: A psychologically significant level and also near the previous swing highs and volume node.
Immediate Support
Around 97,000: Where price found an initial bounce on the large sell-off.
Around 95,000: The next potential zone if 97,000 breaks.
5. Short-Term (Next 12 Hours) Price Outlook
Likely Scenario (Sideways to Slight Rebound)
The price may range between 97,000 (support) and 99,500 (local resistance).
If buyers step in at 97,000 again, expect a mild recovery toward the 99,000–100,000 region.
Bullish Breakout
If BTC reclaims the 99,500–100,000 zone with strong buying volume, it could target 100,500–101,000 next.
Watch for a 30-min candle close above the 50 MA to confirm potential upside momentum.
Bearish Continuation
If price fails to hold 97,000, a deeper retracement to 95,000 or lower may occur.
Sustained trading below the 200 MA would reinforce near-term bearish momentum.
Disclaimer
The information and publications are not meant to be, and do not constitute, financial, investment, trading, or other types of advice or recommendations supplied or endorsed by TradingView. Read more in the Terms of Use.
Disclaimer
The information and publications are not meant to be, and do not constitute, financial, investment, trading, or other types of advice or recommendations supplied or endorsed by TradingView. Read more in the Terms of Use.