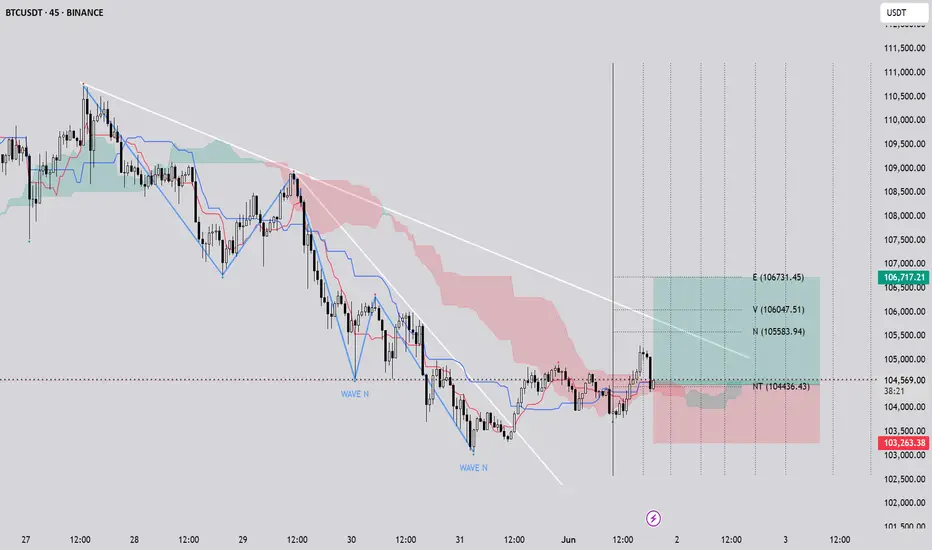
The BTCUSDT 45-minute chart presents a promising setup for a buy position. A significant downtrend line has been broken, followed by a successful retest, suggesting a potential trend reversal. The Ichimoku Cloud reinforces this bullish outlook, with the price breaking above the cloud, indicating strengthening momentum. Additionally, the chart features a clear Wave N formation, a key pattern in wave theory, which further supports the bullish bias. This combination of a trendline break with retest, Ichimoku confirmation, and Wave N structure provides a solid foundation for considering a buy position.
If you liked this analysis, hit the BOOST !
If you liked this analysis, hit the BOOST !
Trade active
N and V waves were formed and their respective targets were touched. You can continue to wait for target E to be touched or close your trades manually.If you liked this analysis, hit the BOOST !
Trade closed: target reached
Target E was touched and the price can continue to move towards the next targets. But we exit the trade at this point and close our positionIf you liked this analysis, hit the BOOST !
Disclaimer
The information and publications are not meant to be, and do not constitute, financial, investment, trading, or other types of advice or recommendations supplied or endorsed by TradingView. Read more in the Terms of Use.
Disclaimer
The information and publications are not meant to be, and do not constitute, financial, investment, trading, or other types of advice or recommendations supplied or endorsed by TradingView. Read more in the Terms of Use.