📉 Pattern Identified: Head and Shoulders
🕰️ Timeframe: Short to Medium-term
💰 Pair: BTC/USDT
📍 Exchange: Binance (or relevant exchange)
🔍 Pattern Breakdown:
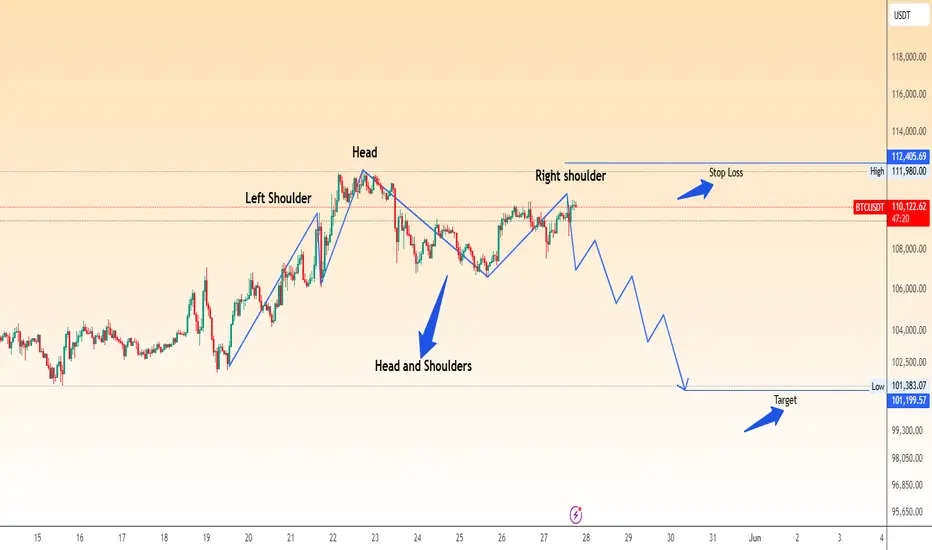
We can clearly identify a Head and Shoulders pattern forming on the BTCUSDT chart. This classic bearish reversal pattern indicates a potential trend change from bullish to bearish. Here's the structure:
Left Shoulder: A steady price rise followed by a peak and a pullback.
Head: A higher peak than the left shoulder, forming the top of the trend.
Right Shoulder: A lower high, roughly mirroring the left shoulder, followed by price weakening.
The neckline is drawn connecting the two troughs between the shoulders and the head. A confirmed break below this neckline usually signals a bearish move.
📊 Current Price Action:
Price: $110,295.80 (at the time of the chart)
Stop Loss: Above the right shoulder — around $112,405.69
Bearish Target: $101,199.57, near the support zone and previous demand area.
This potential move offers a favorable risk-to-reward ratio for short sellers upon confirmation of neckline break.
📌 Trade Plan (Hypothetical):
Entry: On a confirmed break and close below the neckline.
Stop Loss: Just above the right shoulder.
Take Profit: Around $101,200 zone.
⚠️ Notes:
Confirmation is key: Wait for a break and retest of the neckline.
Avoid entering prematurely; the right shoulder is still forming.
Combine with other indicators (e.g., RSI divergence, volume analysis) for more confidence.
🧠 Summary:
This Head and Shoulders setup is a reliable technical pattern and suggests a possible bearish reversal in BTC/USDT. If the neckline breaks with conviction, we could see a move toward the $101K zone. Traders should manage risk appropriately and wait for confirmation before entering any positions.
Related publications
Disclaimer
The information and publications are not meant to be, and do not constitute, financial, investment, trading, or other types of advice or recommendations supplied or endorsed by TradingView. Read more in the Terms of Use.
Related publications
Disclaimer
The information and publications are not meant to be, and do not constitute, financial, investment, trading, or other types of advice or recommendations supplied or endorsed by TradingView. Read more in the Terms of Use.