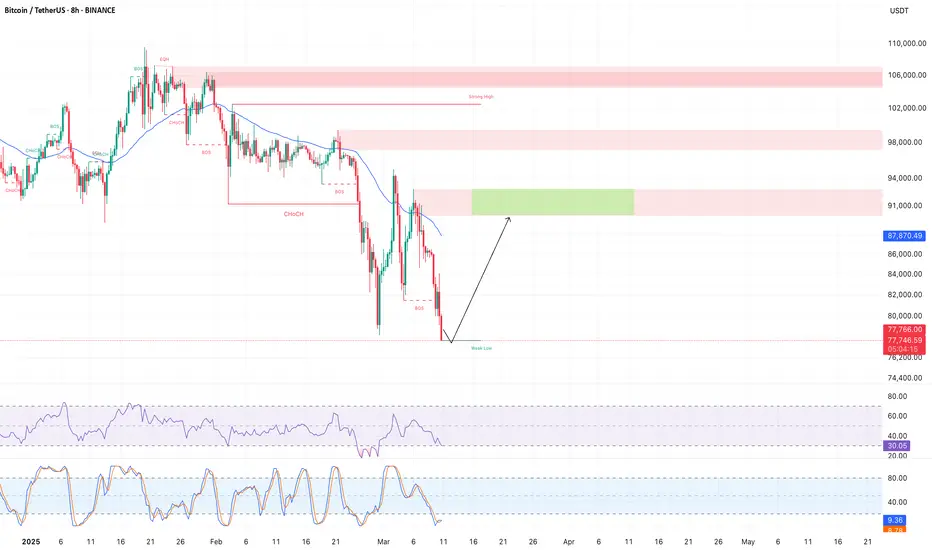
Bitcoin’s long-term macro structure does not currently align with bear market conditions as defined by sustained price decay below key moving averages or a violation of multi-year structural support. Presently, the market exhibits characteristics of a consolidation phase within a broader uptrend, presenting asymmetric opportunities across micro, medium, and macro timeframes for participants who anchor decisions to quantifiable support/resistance zones, Fibonacci retracements, and volume-weighted price anchors. The current price regime between $70,000 and $80,000 represents a high-probability accumulation zone, validated by the incomplete Wave 5 extension (post-election rally), which implies unresolved cyclical momentum, historical fractal patterns suggesting Wave 5 extensions often retrace 38.2–50% of Wave 3, on-chain metrics such as dormant supply accumulation (declining exchange reserves) and rising HODLer net positions signaling smart money redistribution, and risk-reward asymmetry tied to the 78,000–73,000 zone’s alignment with the 2024 realized price (~$69,000) and the 200-day moving average. Position management should prioritize a dollar-cost averaging strategy within the 70,000–80,000 zone, weighted toward Fibonacci retracement levels (78.6%, 61.8%), and volatility-adjusted sizing using the Average True Range to align risk per trade with portfolio volatility targets. Behavioral risks such as retail panic (measured by Fear & Greed Index extremes) and media-driven FUD create liquidity voids exploitable by informed participants, while Bitcoin’s cyclical patterns (halving-driven supply shocks, four-year cycles) mirror 2013–2017 fractals, underscoring the asset’s asymmetric return profile. Disciplined investors recognize that volatility is the premium paid for non-correlated alpha, and Bitcoin’s current structure—anchored by on-chain fundamentals and cyclical tailwinds—rewards systematic, mathematically rigorous strategies focused on position sizing, risk management, and predefined triggers. Markets oscillate between fear and greed, and the 70,000–80,000 zone represents where capital is deployed by those who understand that risk is managed, not avoided, and that asymmetric opportunities arise from preparation rather than prediction. Ignoring noise and trusting data-driven analysis remains critical to navigating this phase.
Alex Kostenich,
Horban Brothers.
Alex Kostenich,
Horban Brothers.
Trade active
Actual.Trade closed: target reached
Horban Brothers - Innovative finance. Join our journey:
Telegram Channel: t.me/horbanbrothers
X: x.com/HorbanBrothers
Telegram Channel: t.me/horbanbrothers
X: x.com/HorbanBrothers
Related publications
Disclaimer
The information and publications are not meant to be, and do not constitute, financial, investment, trading, or other types of advice or recommendations supplied or endorsed by TradingView. Read more in the Terms of Use.