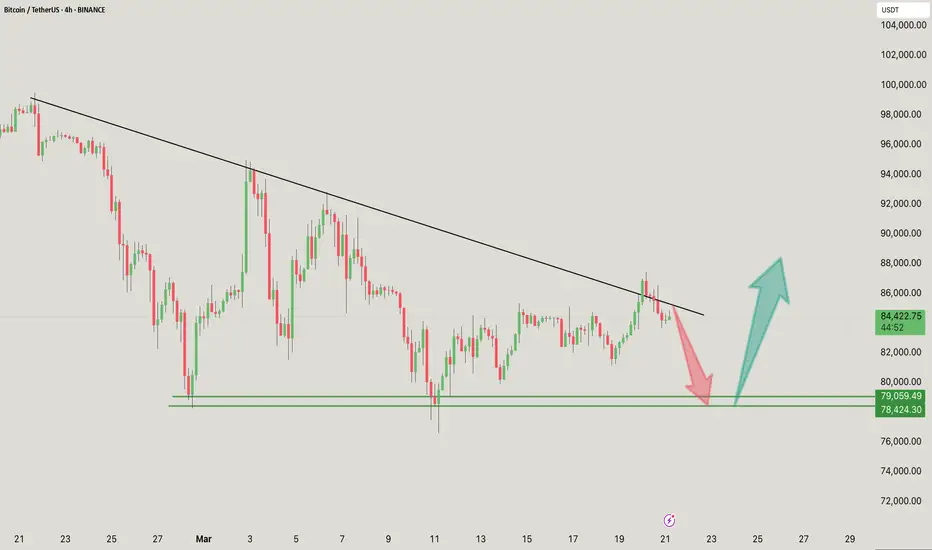
The Bitcoin (BTC/USDT) 4-hour chart suggests a key decision point near descending trendline resistance.
BTC is testing a key descending trendline, which has acted as resistance multiple times.
Rejection from this level could lead to a retracement towards the $79,000 – $78,400 support area (red arrow).
If BTC breaks above the trendline with strong volume, it could signal a bullish continuation towards $88,000+ (green arrow).
Immediate Resistance: $85,000
Key Support Area: $79,000 – $78,400
Breakout Target: $88,000+
If you found this analysis helpful, hit the Like button and share your thoughts or questions in the comments below. Your feedback matters!
Thanks for your support!
DYOR. NFA
Related publications
Disclaimer
The information and publications are not meant to be, and do not constitute, financial, investment, trading, or other types of advice or recommendations supplied or endorsed by TradingView. Read more in the Terms of Use.
Related publications
Disclaimer
The information and publications are not meant to be, and do not constitute, financial, investment, trading, or other types of advice or recommendations supplied or endorsed by TradingView. Read more in the Terms of Use.