Good morning ladies and gentlemen and welcome back to my daily look into the world of Bitcoin. Today I have the daily time frame pulled up and not much has changed since yesterday. I dont expect much from the weekend either. The monthly candle is coming to a close very soon and things dont really look great over the month of September anyways. Lots of downs mixed with some ups. Still plenty of money to be made regardless. The daily is telling me plenty this morning though so I decided to analyze it. So buckle up and get ready for the most exciting analysis you have ever read.
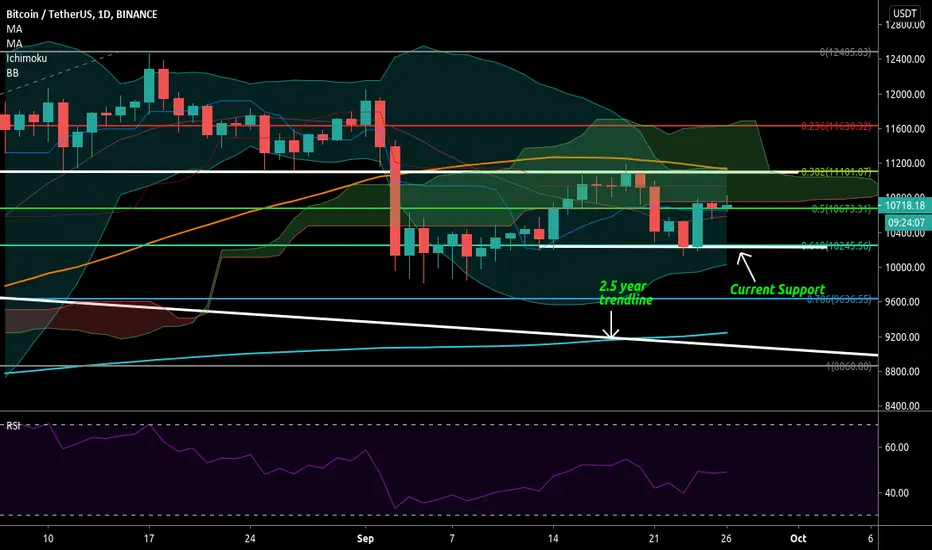
We see resistance is at the daily cloud. Also the .5 fib is in the mix. The .5 fib is just below the bottom border of the daily cloud and as a result we are having a difficult time breaking above resistance. I see some good news on different time frames but it seems to be fleeting at best. The daily shows resistance at the bottom of the cloud which I mentioned earlier (10760 approximately) If we can break into this daily cloud things will be more bullish. Although being inside of any cloud is not really considered bullish. But it is better than being below the cloud. We are still fighting to get back inside of the daily cloud but we did overcome another cloud and that is the 4hr cloud.
The 4hr cloud is much thinner and as a result we broke through the cloud just recently. We also have muscled our way back above the 4hr 50 MA . This development is on the razors edge so to speak due to the fact we are testing support hard currently. If the 4hr 50 MA can hold I think we have a real chance to penetrate the daily cloud before the weekends end. Of course only time will tell for sure. 11100 is a key area I am looking at. We spent plenty of time with this level acting as support during August and while we were chilling up there we made a head and shoulders. Right after that developed we dropped nearly 2k.. Im hoping that things can turn around from here.
The candles are still above 10k and I will consider that a win. Even if we drop to 4 figure Bitcoin I still think we will be good if we can remain above the 2.5 year trend line we broke above In August. Lets hope the candles dont get that low (9k) but its nice to know where support may show its face if the stuff hits the fan. Current support lies on the .618 fib or 10260. Resistance is around 10760. We need to blow through this resistance in order to wake the bulls up and cause the rally we all want to see. Im not expecting a miracle or anything but I will suggest that if you are long set a stop loss. I know I say that often but it is very important.. Identifying support and resistance on a chart is the most important thing a trader can learn. I hope you all have a great weekend. Make good choices. WTFDIK???
TLDR: Same old same old. 10260 is support and 10760 is resistance (bottom border of the daily cloud) 11100 would be the next hurdle. We have the 4hr 50 MA below us for the first time in days. Lets see if the bulls can do something with this.
Disclaimer
The information and publications are not meant to be, and do not constitute, financial, investment, trading, or other types of advice or recommendations supplied or endorsed by TradingView. Read more in the Terms of Use.
Disclaimer
The information and publications are not meant to be, and do not constitute, financial, investment, trading, or other types of advice or recommendations supplied or endorsed by TradingView. Read more in the Terms of Use.