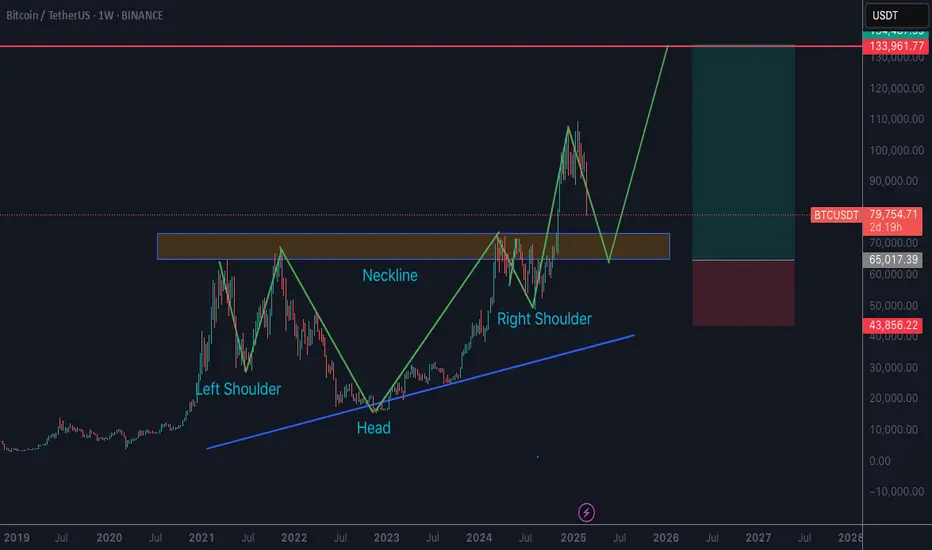
On the higher timeframes we have a text book explanation of the current market correction.
You can see the clear formation of an inverse H&S pattern. The impulse move to 109K was a breakout above the neckline. The current correction is a pullback into the neckline.
I'm expecting price to find support around the 62K demand zone. This is the most likely area for a reversal before we go higher. Trade smart
Disclaimer
The information and publications are not meant to be, and do not constitute, financial, investment, trading, or other types of advice or recommendations supplied or endorsed by TradingView. Read more in the Terms of Use.
Disclaimer
The information and publications are not meant to be, and do not constitute, financial, investment, trading, or other types of advice or recommendations supplied or endorsed by TradingView. Read more in the Terms of Use.