BTC/USDT Analysis (1H Timeframe)
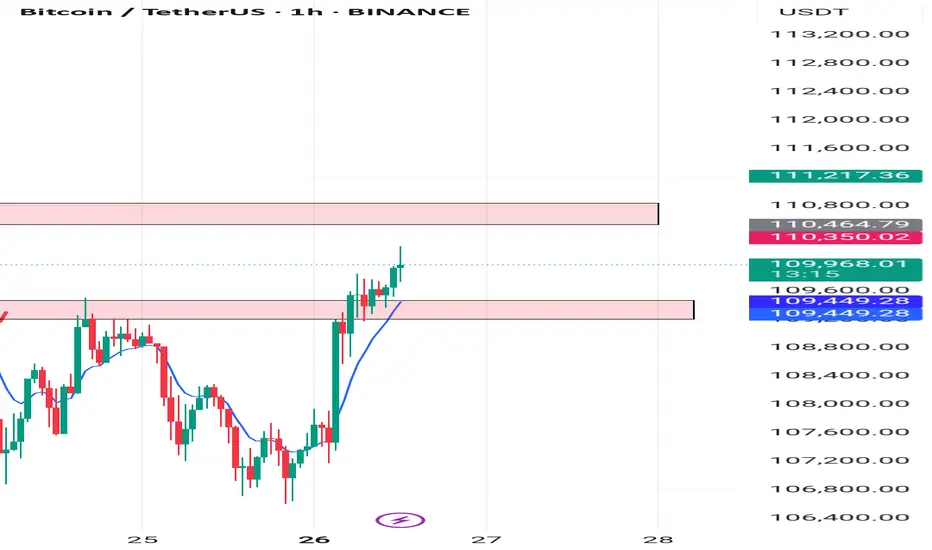
Bitcoin has broken above a key resistance zone around $109,462, showing strong bullish momentum. The price has now entered a higher resistance area near $110,350 – $110,464.
Trend: Short-term bullish, as seen by the strong impulsive move and price staying above the EMA line.
Support: The previously broken resistance at $109,462 could now act as support if retested.
Resistance: The current zone between $110,350 – $110,464 is acting as resistance. If this zone is cleared, the next target could be $111,217.
Bias: Bullish continuation is likely if price sustains above $110,350. However, rejection from this resistance could lead to a minor pullback toward $109,462.
Disclaimer
The information and publications are not meant to be, and do not constitute, financial, investment, trading, or other types of advice or recommendations supplied or endorsed by TradingView. Read more in the Terms of Use.
Disclaimer
The information and publications are not meant to be, and do not constitute, financial, investment, trading, or other types of advice or recommendations supplied or endorsed by TradingView. Read more in the Terms of Use.