🟢 BTCUSDT – Strong Bullish Reversal Setup from Key Demand Zone | Long Trade Opportunity
📅 Date: May 25, 2025
📍 Symbol: BTC/USDT
🕰️ Timeframe: (assumed 1H / 4H – adjust based on your actual timeframe)
🔍 Strategy: Support Reversal | Swing Trade
🎯 Bias: Bullish
🔍 Chart Analysis & Pattern Description:
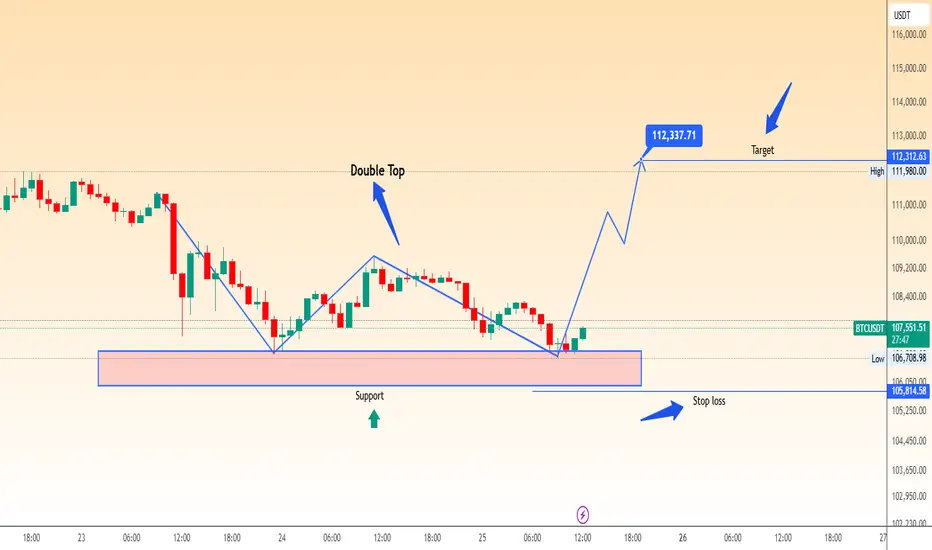
The BTCUSDT chart shows a bullish reversal pattern developing after a pronounced downtrend. Price has recently tested a strong horizontal support zone (highlighted in the red box), forming what appears to be a double bottom or accumulation zone. This structure often signals buyer absorption of selling pressure, suggesting a potential shift in momentum from bearish to bullish.
🔸 Key Support Zone (Demand Area)
The zone between 106,100 – 106,700 USDT has proven to be a critical level where price has historically reacted.
Multiple long-tailed wicks and rejection candles indicate aggressive buying activity each time price dips into this area.
This support is both a technical level (based on price structure) and a psychological threshold where bulls step in.
🔸 Market Structure Transition
The downtrend formed a series of lower highs and lower lows.
Recently, price created a higher low within the support zone, hinting at a possible trend shift.
Break of the minor trendline resistance confirms bullish intent, initiating a possible leg up.
🔸 Trade Entry
Entry is placed around 107,393 USDT, just above the support and following bullish confirmation candles.
📈 Trade Setup Overview:
Component Level
Entry 107,393 USDT
Stop-Loss 105,814 USDT
Target (TP1) 111,980 USDT (swing high)
Target (TP2) 112,337 USDT (extension)
🔹 Stop-Loss Justification
Placed just below the support zone at 105,814 USDT. This allows for natural volatility while avoiding deeper invalidation of the structure.
🔹 Target Zone
The target at 112,337 USDT aligns with:
A previous resistance level or high
A Fibonacci extension / measured move from the recent impulse leg
Psychological round number resistance
📊 Risk-Reward Ratio:
Risk: ~1,579 USDT
Reward: ~4,944 USDT
Risk-Reward Ratio: ~1:3.13
This is an ideal RRR for swing trades, giving a cushion for volatility while offering significant upside.
🧠 Trader’s Psychology & Rationale:
This pattern represents a classic market structure shift, where smart money often accumulates positions before initiating a reversal. The following psychological elements are in play:
Retail traders are shaken out during the downtrend.
Institutions accumulate around the low-volume zone (support).
Once the pressure exhausts sellers, price pushes higher rapidly.
This setup is a textbook example of "Buy Low at Structure", combining:
Strong support
Bullish price action confirmation
Clean invalidation level (stop-loss)
Clear target zone for profit taking
📌 Technical Notes:
Monitor volume on breakout — rising volume will validate the move.
A bullish divergence on RSI or MACD can strengthen confirmation.
If price breaks below 105,814, consider it invalid and exit.
⚠️ Disclaimer:
This analysis is for educational and informational purposes only. It does not constitute financial advice. Always perform your own research and use appropriate risk management
📅 Date: May 25, 2025
📍 Symbol: BTC/USDT
🕰️ Timeframe: (assumed 1H / 4H – adjust based on your actual timeframe)
🔍 Strategy: Support Reversal | Swing Trade
🎯 Bias: Bullish
🔍 Chart Analysis & Pattern Description:
The BTCUSDT chart shows a bullish reversal pattern developing after a pronounced downtrend. Price has recently tested a strong horizontal support zone (highlighted in the red box), forming what appears to be a double bottom or accumulation zone. This structure often signals buyer absorption of selling pressure, suggesting a potential shift in momentum from bearish to bullish.
🔸 Key Support Zone (Demand Area)
The zone between 106,100 – 106,700 USDT has proven to be a critical level where price has historically reacted.
Multiple long-tailed wicks and rejection candles indicate aggressive buying activity each time price dips into this area.
This support is both a technical level (based on price structure) and a psychological threshold where bulls step in.
🔸 Market Structure Transition
The downtrend formed a series of lower highs and lower lows.
Recently, price created a higher low within the support zone, hinting at a possible trend shift.
Break of the minor trendline resistance confirms bullish intent, initiating a possible leg up.
🔸 Trade Entry
Entry is placed around 107,393 USDT, just above the support and following bullish confirmation candles.
📈 Trade Setup Overview:
Component Level
Entry 107,393 USDT
Stop-Loss 105,814 USDT
Target (TP1) 111,980 USDT (swing high)
Target (TP2) 112,337 USDT (extension)
🔹 Stop-Loss Justification
Placed just below the support zone at 105,814 USDT. This allows for natural volatility while avoiding deeper invalidation of the structure.
🔹 Target Zone
The target at 112,337 USDT aligns with:
A previous resistance level or high
A Fibonacci extension / measured move from the recent impulse leg
Psychological round number resistance
📊 Risk-Reward Ratio:
Risk: ~1,579 USDT
Reward: ~4,944 USDT
Risk-Reward Ratio: ~1:3.13
This is an ideal RRR for swing trades, giving a cushion for volatility while offering significant upside.
🧠 Trader’s Psychology & Rationale:
This pattern represents a classic market structure shift, where smart money often accumulates positions before initiating a reversal. The following psychological elements are in play:
Retail traders are shaken out during the downtrend.
Institutions accumulate around the low-volume zone (support).
Once the pressure exhausts sellers, price pushes higher rapidly.
This setup is a textbook example of "Buy Low at Structure", combining:
Strong support
Bullish price action confirmation
Clean invalidation level (stop-loss)
Clear target zone for profit taking
📌 Technical Notes:
Monitor volume on breakout — rising volume will validate the move.
A bullish divergence on RSI or MACD can strengthen confirmation.
If price breaks below 105,814, consider it invalid and exit.
⚠️ Disclaimer:
This analysis is for educational and informational purposes only. It does not constitute financial advice. Always perform your own research and use appropriate risk management
Related publications
Disclaimer
The information and publications are not meant to be, and do not constitute, financial, investment, trading, or other types of advice or recommendations supplied or endorsed by TradingView. Read more in the Terms of Use.
Related publications
Disclaimer
The information and publications are not meant to be, and do not constitute, financial, investment, trading, or other types of advice or recommendations supplied or endorsed by TradingView. Read more in the Terms of Use.