BTCUSDTPERP analysis
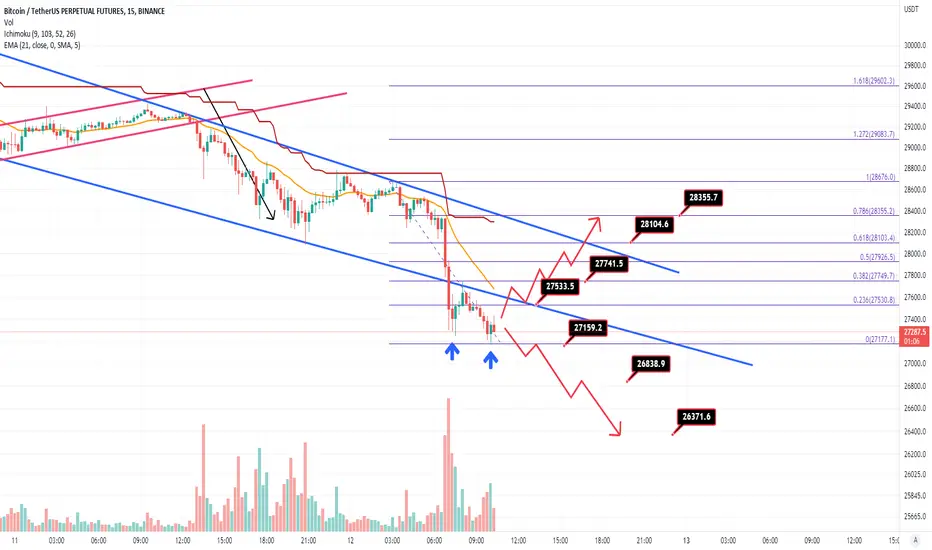
15M time frame
In this time frame, after falling in price with a high motion montage, the price has entered its correction phase after hitting the $ 27200 support level.
As you can see in the picture, the price has a DOUBLE BOTTOM technical pattern.
If the price crosses the neckline and resistance level of $ 27,600 with a valid candlestick, a short-term bullish scenario will be activated and we will expect the following level:
TP1: 27750
TP2: 28100
TP3: 28350
Also, if the price crosses the support level of $ 27150 with a valid candlestick, the downtrend scenario will continue and we will expect the following level:
TP1: 26850
TP2: 26400
good luck
DAAN
Disclaimer
The information and publications are not meant to be, and do not constitute, financial, investment, trading, or other types of advice or recommendations supplied or endorsed by TradingView. Read more in the Terms of Use.
Disclaimer
The information and publications are not meant to be, and do not constitute, financial, investment, trading, or other types of advice or recommendations supplied or endorsed by TradingView. Read more in the Terms of Use.