Citigroup’s stock has gained over 2% in the last trading session, as its latest earnings results have supported a moderately bullish bias on the current price chart. The company reported earnings per share (EPS) of $1.96, beating the expected $1.85, while revenue reached $21.6 billion, exceeding the forecast of $21.29 billion. These positive figures triggered a bullish price gap, which is currently sustaining steady upward pressure on the stock.
Downtrend in Focus
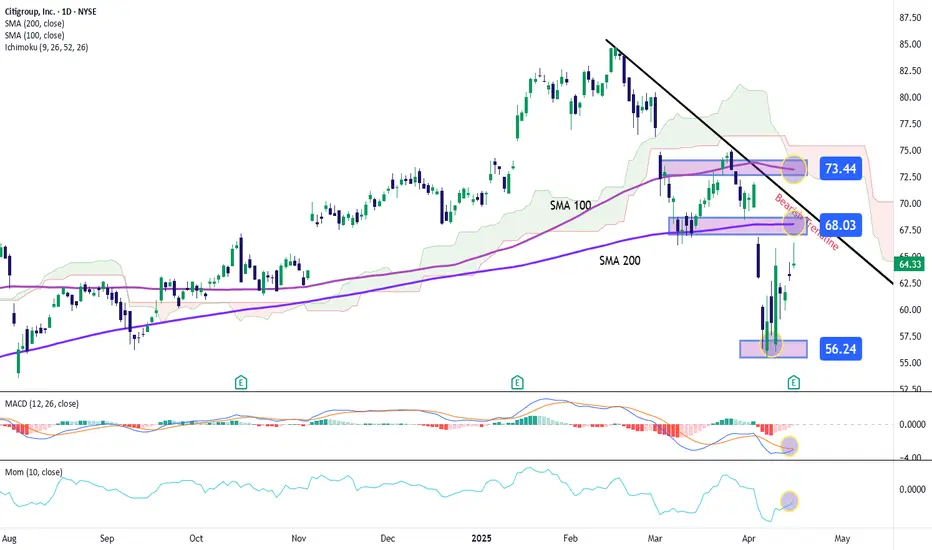
Despite the recent upward movement, the chart continues to show a consistent downtrend that has been in place since February 18. Although buying momentum has increased in recent sessions, the price remains within the broader bearish trend, which still dominates in the short term. For now, this trendline continues to be the most relevant technical structure to watch.
MACD
For the first time in nearly 10 sessions, the MACD histogram has returned to the zero line after a prolonged period in negative territory. This may indicate a strengthening bullish momentum. Additionally, both the MACD line and the signal line are showing signs of a bullish crossover, further highlighting potential short-term buying interest. If these technical conditions persist, buying pressure may become increasingly relevant.
Momentum
The momentum indicator over the last 10 sessions has maintained a steady upward slope, gradually approaching the neutral zero line. This reinforces the outlook for a renewed buying push in the price action.
Both technical indicators are currently signaling a slight increase in bullish momentum. However, the price still needs to challenge the 200-period moving average — a key resistance level — to confirm a clearer short-term direction.
Key Levels:
Written by Julian Pineda, CFA – Market Analyst
Downtrend in Focus
Despite the recent upward movement, the chart continues to show a consistent downtrend that has been in place since February 18. Although buying momentum has increased in recent sessions, the price remains within the broader bearish trend, which still dominates in the short term. For now, this trendline continues to be the most relevant technical structure to watch.
MACD
For the first time in nearly 10 sessions, the MACD histogram has returned to the zero line after a prolonged period in negative territory. This may indicate a strengthening bullish momentum. Additionally, both the MACD line and the signal line are showing signs of a bullish crossover, further highlighting potential short-term buying interest. If these technical conditions persist, buying pressure may become increasingly relevant.
Momentum
The momentum indicator over the last 10 sessions has maintained a steady upward slope, gradually approaching the neutral zero line. This reinforces the outlook for a renewed buying push in the price action.
Both technical indicators are currently signaling a slight increase in bullish momentum. However, the price still needs to challenge the 200-period moving average — a key resistance level — to confirm a clearer short-term direction.
Key Levels:
- $56 – Key Support: This level represents the recent weekly lows. A move down to this area could strengthen the prevailing downtrend.
- $68 – Near Resistance: Aligned with the 200-period moving average, a breakout above this level could challenge the current downtrend and confirm renewed bullish strength in the short term.
- $73 – Distant Resistance: This level aligns with the 100-period moving average. Price action approaching this area could confirm the emergence of a new upward trend.
Written by Julian Pineda, CFA – Market Analyst
Disclaimer
The information and publications are not meant to be, and do not constitute, financial, investment, trading, or other types of advice or recommendations supplied or endorsed by TradingView. Read more in the Terms of Use.
Disclaimer
The information and publications are not meant to be, and do not constitute, financial, investment, trading, or other types of advice or recommendations supplied or endorsed by TradingView. Read more in the Terms of Use.