Based on your CAD/JPY chart analysis, here are key levels I can identify:
Entry Point:
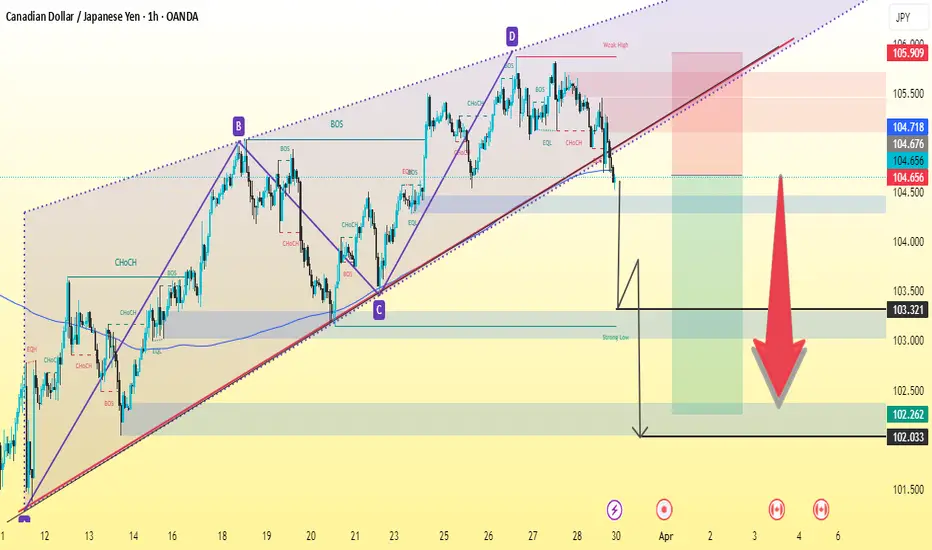
A sell entry seems valid after a break below 104.656, confirming bearish momentum.
Stop Loss (SL105.900):
Place SL above the recent highs, likely around 105.900 , depending on your risk tolerance.
Take Profit (TP) / Target Zones:
First Support Zone: 103.500
Second Support Zone: 102.800
Final Target: 102.000 (as indicated by the large red arrow)
Support & Resistance Zones:
Major Resistance: 104.800 - 105.000
First Support: 103.500
Second Support: 102.800
Key Demand Zone: 102.000
This setup follows a breakout-retest strategy before continuation to the downside. Let me know if you need refinements!
Entry Point:
A sell entry seems valid after a break below 104.656, confirming bearish momentum.
Stop Loss (SL105.900):
Place SL above the recent highs, likely around 105.900 , depending on your risk tolerance.
Take Profit (TP) / Target Zones:
First Support Zone: 103.500
Second Support Zone: 102.800
Final Target: 102.000 (as indicated by the large red arrow)
Support & Resistance Zones:
Major Resistance: 104.800 - 105.000
First Support: 103.500
Second Support: 102.800
Key Demand Zone: 102.000
This setup follows a breakout-retest strategy before continuation to the downside. Let me know if you need refinements!
Trade active
"🔥 Every single target smashed! 🎯 Bags secured! 💰 BOOM BOOM BOOM! Let’s gooo! 🚀 Close all trades and enjoy the profits!"Want a few more variations to choose from?
Disclaimer
The information and publications are not meant to be, and do not constitute, financial, investment, trading, or other types of advice or recommendations supplied or endorsed by TradingView. Read more in the Terms of Use.
Disclaimer
The information and publications are not meant to be, and do not constitute, financial, investment, trading, or other types of advice or recommendations supplied or endorsed by TradingView. Read more in the Terms of Use.