Overview (Weekly Timeframe):
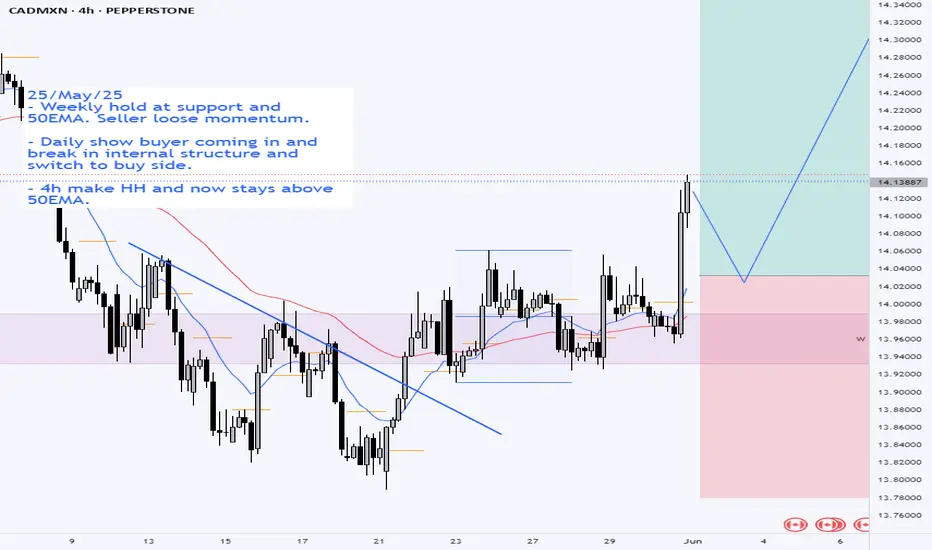
CADMXN is holding strong at a significant weekly support zone, aligning with the 50EMA 🟢. Sellers are losing steam as price stabilizes, hinting at a potential bullish reversal. This level has historically acted as a base for upward moves, making it a key zone to watch.
Daily Chart Explanation:
On the daily chart, price action confirms a shift in momentum. Buyers have stepped in and successfully broken internal bearish structure, indicating a transition to the buy side 📈. The structure break signals that bulls are gaining control, and the market sentiment is turning positive.
4H Chart Explanation:
The 4H chart shows a clear bullish structure with higher highs (HH) and higher lows forming. Price is holding above the 50EMA, a strong indicator that the bullish momentum is now in play. The alignment of structure and moving average further supports long entries.
Plan:
🔹 Bias: Bullish
🔹 Entry: Look for pullback into 4H demand zone or dynamic support near 50EMA
🔹 Targets:
• TP1 – Previous swing high on Daily
• TP2 – Next major resistance zone from Weekly
🔹 Invalidation: Break below 4H higher low structure and drop under 50EMA
Note
First entry triggered.Disclaimer
The information and publications are not meant to be, and do not constitute, financial, investment, trading, or other types of advice or recommendations supplied or endorsed by TradingView. Read more in the Terms of Use.
Disclaimer
The information and publications are not meant to be, and do not constitute, financial, investment, trading, or other types of advice or recommendations supplied or endorsed by TradingView. Read more in the Terms of Use.