🧠 Complete Technical Analysis:
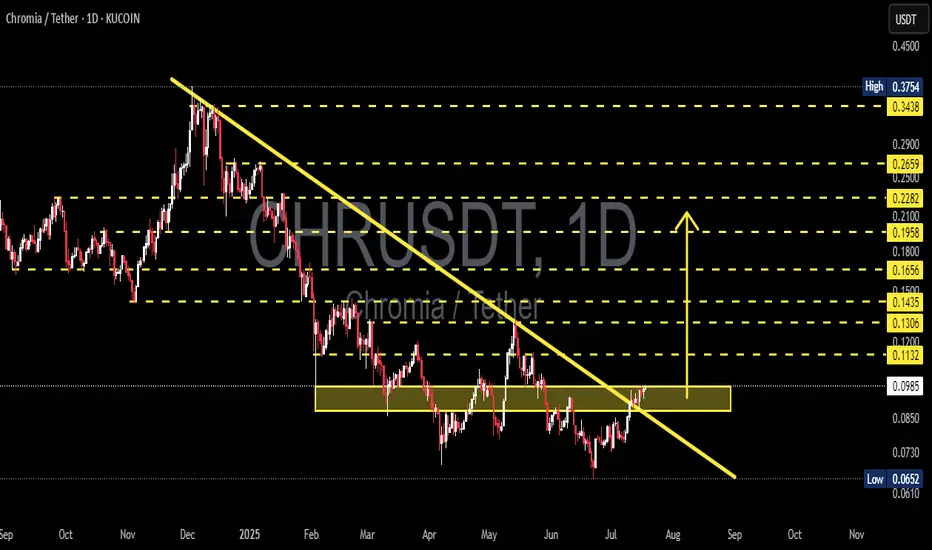
After months of being trapped in a prolonged downtrend since December 2024, Chromia (CHR) has finally shown signs of awakening. The price has successfully broken out of a major descending trendline, while also breaching a critical consolidation resistance zone between $0.093–$0.098 (highlighted in yellow).
This breakout not only indicates a potential trend reversal, but also opens the door for a medium-term bullish rally if sustained.
📊 Structure and Pattern Highlights:
Descending Trendline Breakout: CHR has decisively broken out of the long-standing bearish structure.
Validated Accumulation Zone: The $0.075–$0.098 range has proven to be a strong accumulation base after multiple tests.
Layered Horizontal Resistances: A clear ladder of resistance levels awaits as price pushes upward.
Potential Bullish Patterns: With a healthy pullback and higher low, CHR could form an Inverse Head and Shoulders or a Bullish Flag continuation pattern.
📈 Bullish Scenario:
If CHR can hold daily candle closes above the $0.098 breakout zone, the following targets come into play:
Target Level Description
$0.113 Breakout confirmation zone
$0.120 Psychological mini-resistance
$0.130 Historical horizontal resistance
$0.143 Previous local top
$0.165 Key breakdown level
$0.180 – $0.228 Medium-term target range with historical supply
$0.265 – $0.290 Strong resistance area from past distribution
$0.343 – $0.375 Long-term bullish target
💡 Note: If buying volume increases and BTC remains stable or bullish, these targets become increasingly realistic.
📉 Bearish Scenario:
However, if this breakout turns out to be a fakeout, CHR may fall back below the $0.093 zone and retest:
$0.085 (minor support)
$0.075 (base support)
As low as the demand zone around $0.065–$0.070
📌 Candle close and volume confirmation are critical. Avoid chasing price without solid validation!
📎 Conclusion & Strategy:
> CHR/USDT is currently at a pivotal moment. This breakout from a multi-month downtrend signals a potential trend reversal and a medium-term opportunity for swing traders and position holders.
📈 Trading Strategy Suggestion:
Entry: After a successful retest of the $0.095–$0.098 zone
Stop Loss: Below $0.085
Take Profit: Scale out at resistance levels listed above
#CHRUSDT #Chromia #CryptoBreakout #TrendReversal #AltcoinSeason #TechnicalAnalysis #CryptoTrading #BullishPattern #BreakoutSignal #ChartSetup
✅ Get Free Signals! Join Our Telegram Channel Here: t.me/TheCryptoNuclear
✅ Twitter: twitter.com/crypto_nuclear
✅ Join Bybit : partner.bybit.com/b/nuclearvip
✅ Benefits : Lifetime Trading Fee Discount -50%
✅ Twitter: twitter.com/crypto_nuclear
✅ Join Bybit : partner.bybit.com/b/nuclearvip
✅ Benefits : Lifetime Trading Fee Discount -50%
Disclaimer
The information and publications are not meant to be, and do not constitute, financial, investment, trading, or other types of advice or recommendations supplied or endorsed by TradingView. Read more in the Terms of Use.