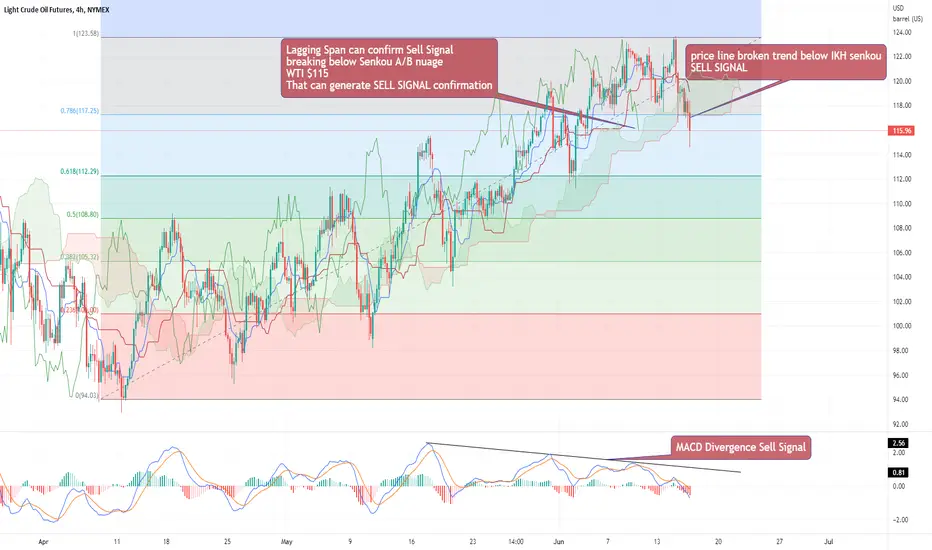
The Crude Oil continuous contract chart on a 4h time scale for the WTI crude has seen a confirmation break of the price line below the IKH Senkou A/B nuage. The Lagging Span line will need also to break below the IKH Senkou A/B support, in order for the Sell Signal to become effective and confirmed. Interesting to see how the oscillator MACD already shaped a diverging oscillation, while a crossover of the signal line also generated a Sell Signal impulse.
Theoretically, WTI price could break below the $100 dollars, important to observe the Fibonacci levels of support .
Theoretically, WTI price could break below the $100 dollars, important to observe the Fibonacci levels of support .
Disclaimer
The information and publications are not meant to be, and do not constitute, financial, investment, trading, or other types of advice or recommendations supplied or endorsed by TradingView. Read more in the Terms of Use.
Disclaimer
The information and publications are not meant to be, and do not constitute, financial, investment, trading, or other types of advice or recommendations supplied or endorsed by TradingView. Read more in the Terms of Use.