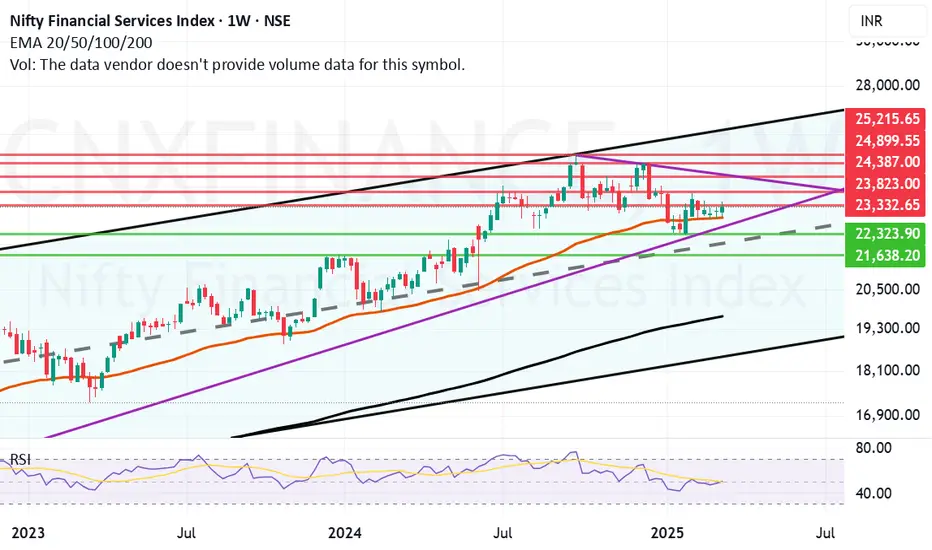
The index that did very well this week and which has potential to carry forward the momentum into the next week seems to be the CNX Financial Service index.
The Financial index looks strongly placed above Mother Line of 50 Weeks EMA line. The resistances it faces or can face if it moves upwards can be 23332 and 23823. The next resistance for CNX Financial services is a major trend line hurdle at 24387. Crossing this can give the index a major breakout and a Free run towards 24899 or even 25K plus levels. The support for CNX Finance is the Mother line at 22890 and 22323. There is also a trend line support at this level. Falling below this level can see CNX Finance drop rapidly towards 21638 or below levels.
Now if this breakout actually happens in the Nifty Financial Services Index the stocks that composites the Finance index will be the beneficiary in general. Some might benefit more some might benefit less and some might not benefit but for index to move upward the stocks composing it have to perform well. To know which stocks will do better than others we will have to look at their individual charts. The stocks which make the Nifty Financial Serviced index are HDFC Bank, ICICI Bank, Kotak Bank, Axis Bank, Kotak Bank, SBI, Bajaj Finance, Bajaj Finserv, HDFC Life, SBI Life, Shriram Finance, Cholamandalam Investment and Finance, PFC, REC, SBI Cards, ICICI Lombard, HDFC Asset Management, SBI Cards, ICICI Prudential Life, LIC Housing Finance, Muthoot Finance and IEX. The Index Can Perform if the majority constituents or the stocks with heavy weightage perform. Some of these stocks can perform others might not. Choose wisely after consulting your investment advisor, studying fundamentals and Technicals of each company.
Disclaimer: The above information is provided for educational purpose, analysis and paper trading only. Please don't treat this as a buy or sell recommendation for the stock or index. The Techno-Funda analysis is based on data that is more than 3 months old. Supports and Resistances are determined by historic past peaks and Valley in the chart. Many other indicators and patterns like EMA, RSI, MACD, Volumes, Fibonacci, parallel channel etc. use historic data which is 3 months or older cyclical points. There is no guarantee they will work in future as markets are highly volatile and swings in prices are also due to macro and micro factors based on actions taken by the company as well as region and global events. Equity investment is subject to risks. I or my clients or family members might have positions in the stocks that we mention in our educational posts. We will not be responsible for any Profit or loss that may occur due to any financial decision taken based on any data provided in this message. Do consult your investment advisor before taking any financial decisions. Stop losses should be an important part of any investment in equity.
Disclaimer
The information and publications are not meant to be, and do not constitute, financial, investment, trading, or other types of advice or recommendations supplied or endorsed by TradingView. Read more in the Terms of Use.
Disclaimer
The information and publications are not meant to be, and do not constitute, financial, investment, trading, or other types of advice or recommendations supplied or endorsed by TradingView. Read more in the Terms of Use.