1. The Big Picture: Wave Structure
Down-trend Completion
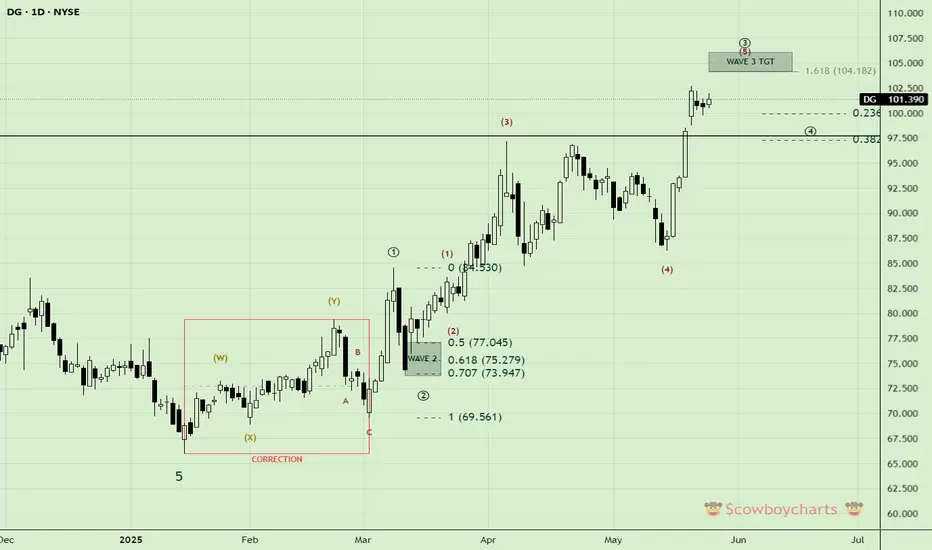
A five-wave decline (labelled “5” at the bottom, ≈ $69.56) finishes in early March 2025.
Complex Correction (W-X-Y)
From December 2024 into March 2025 the market chops out a W-X-Y sideways correction between roughly $70–83.
New Uptrend (Impulse)
Wave 1 up to $84.53
Wave 2 pullback into the 0.5–0.707 zone ($77.05 | 75.28 | 73.95)
Wave 3 powerful thrust into the high-90s
Wave 4 shallow retrace into the mid-$80s
Wave 5 of 3 (current leg) pushing into the low-$100s
2. Current Position: Subwave 5 of Wave 3
Price now: $101.39
We appear to be in the 5th subwave of the larger Wave 3.
That means one more small thrust higher is likely before Wave 3 completes.
3. Target Zone for Wave 3
The 1.618 × Wave 1→3 extension sits at 104.18.
The grey box (~$103–$106) marks our Wave 3 target.
Traders often look to take partial profits as price enters this zone.
4. Key Support / Invalidation Levels
Short-term bump: 23.6% of Wave 4→5, at ≈ $100.00
Primary support: old Wave 4 high / 38.2% retracement, at ≈ $97.50
Invalidation: a clear break below $97.50 would argue that the Wave 5 advance is failing (and could reopen a deeper correction).
5. What Happens After Wave 3?
Once Wave 3 tops out (~104–106), expect a Wave 4 correction of that entire impulse.
Typical Wave 4 depth is 38.2% of Wave 3: that would put a pullback into roughly $90–92.
After Wave 4 completes, a final Wave 5 higher would target new all-time highs.
6. Trading Plan Ideas
Long exposure: add on small dips down to $100–$100.50, keep stops under $97.50.
Partial profit: begin scaling out as price enters $103–$106.
Watch for reversal signals (e.g. bearish divergence, high-volume down days) once inside the grey box—this will mark the end of the impulsive Wave 3.
Bottom line: DG is in the late stages of a textbook Elliott-Wave 3, with one last run higher into the $104–$106 zone likely, then a healthy multi-week pullback (Wave 4) should follow. Keep your stops under $97.50 and look to lock in profits as you approach that extension target.
Down-trend Completion
A five-wave decline (labelled “5” at the bottom, ≈ $69.56) finishes in early March 2025.
Complex Correction (W-X-Y)
From December 2024 into March 2025 the market chops out a W-X-Y sideways correction between roughly $70–83.
New Uptrend (Impulse)
Wave 1 up to $84.53
Wave 2 pullback into the 0.5–0.707 zone ($77.05 | 75.28 | 73.95)
Wave 3 powerful thrust into the high-90s
Wave 4 shallow retrace into the mid-$80s
Wave 5 of 3 (current leg) pushing into the low-$100s
2. Current Position: Subwave 5 of Wave 3
Price now: $101.39
We appear to be in the 5th subwave of the larger Wave 3.
That means one more small thrust higher is likely before Wave 3 completes.
3. Target Zone for Wave 3
The 1.618 × Wave 1→3 extension sits at 104.18.
The grey box (~$103–$106) marks our Wave 3 target.
Traders often look to take partial profits as price enters this zone.
4. Key Support / Invalidation Levels
Short-term bump: 23.6% of Wave 4→5, at ≈ $100.00
Primary support: old Wave 4 high / 38.2% retracement, at ≈ $97.50
Invalidation: a clear break below $97.50 would argue that the Wave 5 advance is failing (and could reopen a deeper correction).
5. What Happens After Wave 3?
Once Wave 3 tops out (~104–106), expect a Wave 4 correction of that entire impulse.
Typical Wave 4 depth is 38.2% of Wave 3: that would put a pullback into roughly $90–92.
After Wave 4 completes, a final Wave 5 higher would target new all-time highs.
6. Trading Plan Ideas
Long exposure: add on small dips down to $100–$100.50, keep stops under $97.50.
Partial profit: begin scaling out as price enters $103–$106.
Watch for reversal signals (e.g. bearish divergence, high-volume down days) once inside the grey box—this will mark the end of the impulsive Wave 3.
Bottom line: DG is in the late stages of a textbook Elliott-Wave 3, with one last run higher into the $104–$106 zone likely, then a healthy multi-week pullback (Wave 4) should follow. Keep your stops under $97.50 and look to lock in profits as you approach that extension target.
Disclaimer
The information and publications are not meant to be, and do not constitute, financial, investment, trading, or other types of advice or recommendations supplied or endorsed by TradingView. Read more in the Terms of Use.
Disclaimer
The information and publications are not meant to be, and do not constitute, financial, investment, trading, or other types of advice or recommendations supplied or endorsed by TradingView. Read more in the Terms of Use.