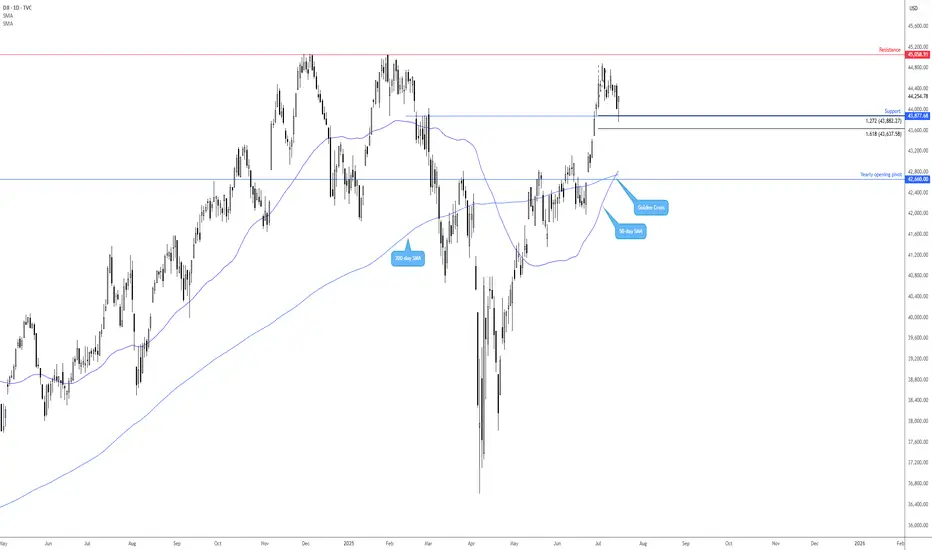
The Dow Jones Industrial Average (DOW) is clearly trending higher, pencilling in a series of higher highs and higher lows. Supporting this trend is the 50-day simple moving average (SMA) at 42,816 crossing above the 200-day SMA at 42,749; this is referred to as a ‘Golden Cross’ and suggests a longer-term uptrend may be on the table.
This, coupled with the recent ‘alternate’ AB=CD bullish formation (1.272% Fibonacci projection ratio) completing at support from 43,877, has already seen buyers step in (with stops potentially located south of the 1.618% Fibonacci projection ratio of 43,637). The next upside objective from here rests around resistance at 45,058, closely shadowed by the all-time high of 45,073.
Written by the FP Markets Research Team
Disclaimer
The information and publications are not meant to be, and do not constitute, financial, investment, trading, or other types of advice or recommendations supplied or endorsed by TradingView. Read more in the Terms of Use.
Disclaimer
The information and publications are not meant to be, and do not constitute, financial, investment, trading, or other types of advice or recommendations supplied or endorsed by TradingView. Read more in the Terms of Use.