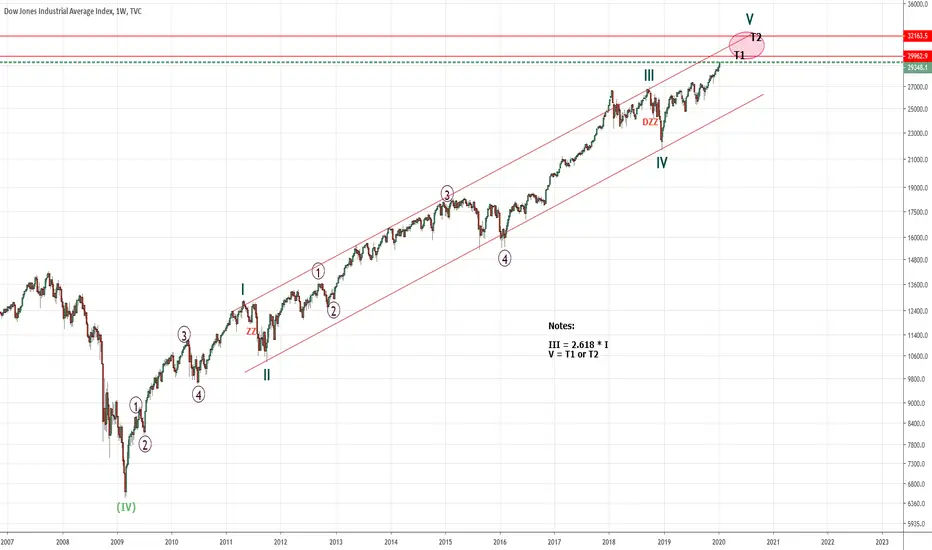
This weekly chart suggests that supercycle wave V may end sometime later this year in the range
of 29962 T1 - 32163 T2
Momentum and RSI have been diverging from price for some time indicating that this long bull run
may be nearing completion.
Parallel trend lines from waves II to IV extended to V highlight the target zone.
Good Luck.
of 29962 T1 - 32163 T2
Momentum and RSI have been diverging from price for some time indicating that this long bull run
may be nearing completion.
Parallel trend lines from waves II to IV extended to V highlight the target zone.
Good Luck.
Disclaimer
The information and publications are not meant to be, and do not constitute, financial, investment, trading, or other types of advice or recommendations supplied or endorsed by TradingView. Read more in the Terms of Use.
Disclaimer
The information and publications are not meant to be, and do not constitute, financial, investment, trading, or other types of advice or recommendations supplied or endorsed by TradingView. Read more in the Terms of Use.