DJI Daily Chart Analysis: Price Rejected at Mid-Band Resistance
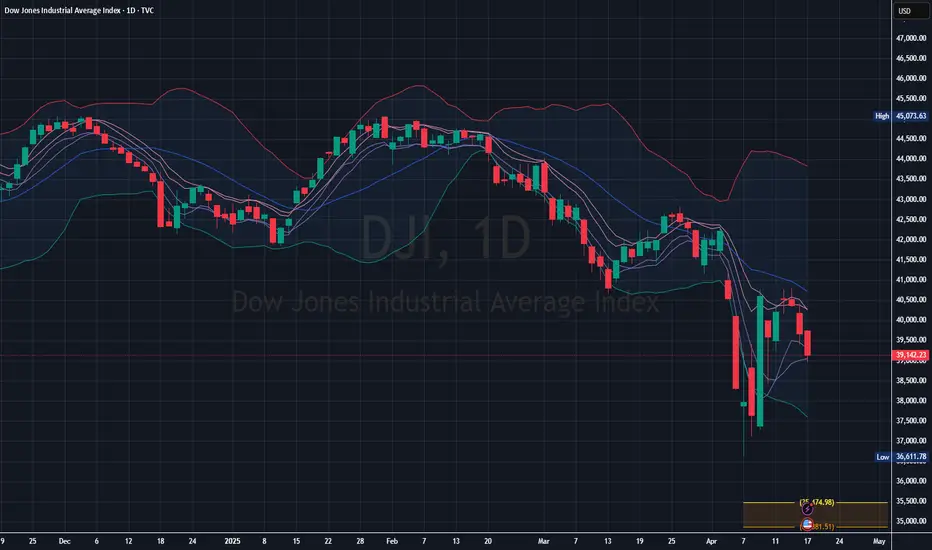
- The price is below the middle line (likely a 20-day moving average) of the Bollinger Bands, which typically signals bearish momentum.
- Recent price action shows a lower high and a lower low pattern, indicating the continuation of a downtrend.
- The candlesticks are mostly red with increasing volume of selling pressure.
- Bands are widening, suggesting increased volatility.
- The price recently pierced the lower Bollinger Band, which often indicates a potential for short-term rebound—but in a strong downtrend, this could also mean acceleration to the downside.
- Key Support Zone : Around 38,000 to 38,500, where previous buying occurred in early April. If broken, further downside to 37,000 is likely.
- Key Resistance Zone : Near 40,500 to 41,000, aligning with the mid-Bollinger Band. This area has been tested and rejected multiple times.
➀➁➂➃➄
Disclaimer
The information and publications are not meant to be, and do not constitute, financial, investment, trading, or other types of advice or recommendations supplied or endorsed by TradingView. Read more in the Terms of Use.
➀➁➂➃➄
Disclaimer
The information and publications are not meant to be, and do not constitute, financial, investment, trading, or other types of advice or recommendations supplied or endorsed by TradingView. Read more in the Terms of Use.