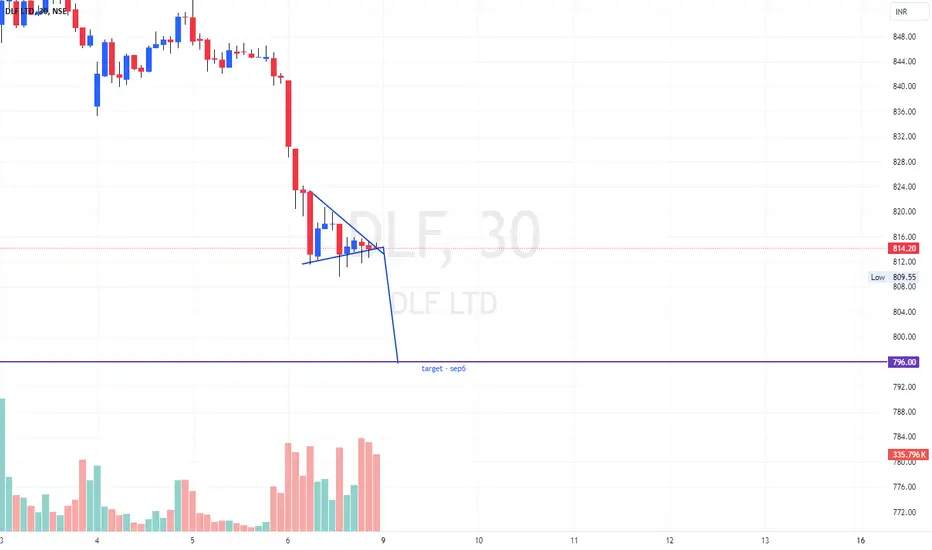
DLF has formed a bearish flag pattern on the sell side in the 30-minute chart, indicating a potential continuation of the downtrend. This bearish flag pattern suggests that the stock may experience a further decline in price, making it a sell signal for traders. The formation of this pattern in a short-term time frame like 30 minutes indicates a strong possibility of a breakdown on the downside, presenting a selling opportunity for investors.
Note
SL hitDisclaimer
The information and publications are not meant to be, and do not constitute, financial, investment, trading, or other types of advice or recommendations supplied or endorsed by TradingView. Read more in the Terms of Use.
Disclaimer
The information and publications are not meant to be, and do not constitute, financial, investment, trading, or other types of advice or recommendations supplied or endorsed by TradingView. Read more in the Terms of Use.