The USD showed oversold conditions via RSI on both the daily and weekly chart as we began Q3. But, so far, the new quarter has shown a change-of-pace, as the currency has continued to rally with another topside breakout today around CPI data.
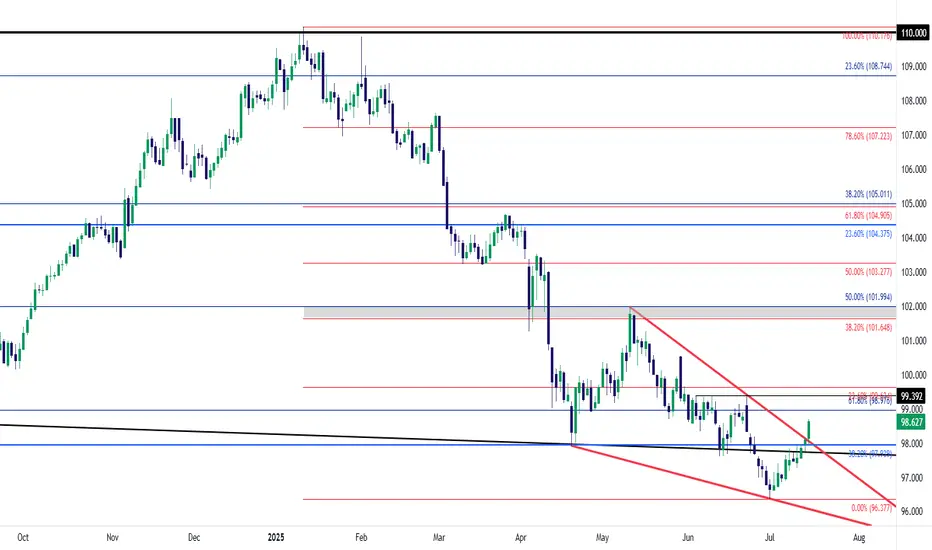
The breakout today happened at a big spot - as the long-term fibonacci level at 97.93 had previously helped to hold support back in April, leading to the bounce that ran into May. More recently that price had come in as resistance, until this morning's breakout. And it was in the immediate aftermath of the CPI release that buyers came in to hold the low at that exact level five minutes after the data dropped, and that led to a strong breakout in the USD as bulls took over.
The move is still fresh, however, as we haven't yet seen 23.6% of the sell-off from H1 get clawed back. The retracement from that move plots at 99.63, with the 100.00 level sitting overhead. Below that price, the 99.39 level remains notable as this was a June swing high, and now functions as a follow-through resistance level.
Bigger picture, it's the 101.65-102.00 zone that bulls will need to show up at to make this into anything more than a corrective pullback in a broader bearish trend. - js
Related publications
Disclaimer
The information and publications are not meant to be, and do not constitute, financial, investment, trading, or other types of advice or recommendations supplied or endorsed by TradingView. Read more in the Terms of Use.
Related publications
Disclaimer
The information and publications are not meant to be, and do not constitute, financial, investment, trading, or other types of advice or recommendations supplied or endorsed by TradingView. Read more in the Terms of Use.