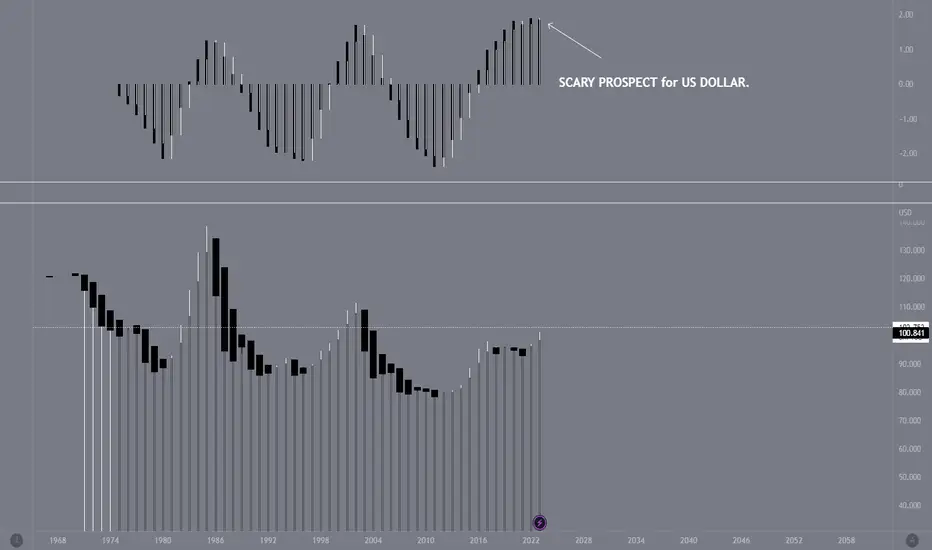
Here's a look at DXY US DOLLAR INDEX on a 12 month chart. This year, it's the second time it signalled a big shift on the upper histogram, last time it did was 2021. Is this the start of the big fall for the USD.
This may last for a few years -- worse a decade.
Again it may or it may not happen, but the 12-month chart doesn't change mind often. I guess we'll see..
This may last for a few years -- worse a decade.
Again it may or it may not happen, but the 12-month chart doesn't change mind often. I guess we'll see..
Trade active
Weekly data for DXY.USDOLLAR will be fighting a hard battle from here on.
Long term downtrend has commenced.
Spotted at 106.0
TAYOR.+
Trade active
brokedown as planned.Congrats shorters, that's a weighty drop. Selling pressure persists.
Disclaimer
The information and publications are not meant to be, and do not constitute, financial, investment, trading, or other types of advice or recommendations supplied or endorsed by TradingView. Read more in the Terms of Use.
Disclaimer
The information and publications are not meant to be, and do not constitute, financial, investment, trading, or other types of advice or recommendations supplied or endorsed by TradingView. Read more in the Terms of Use.