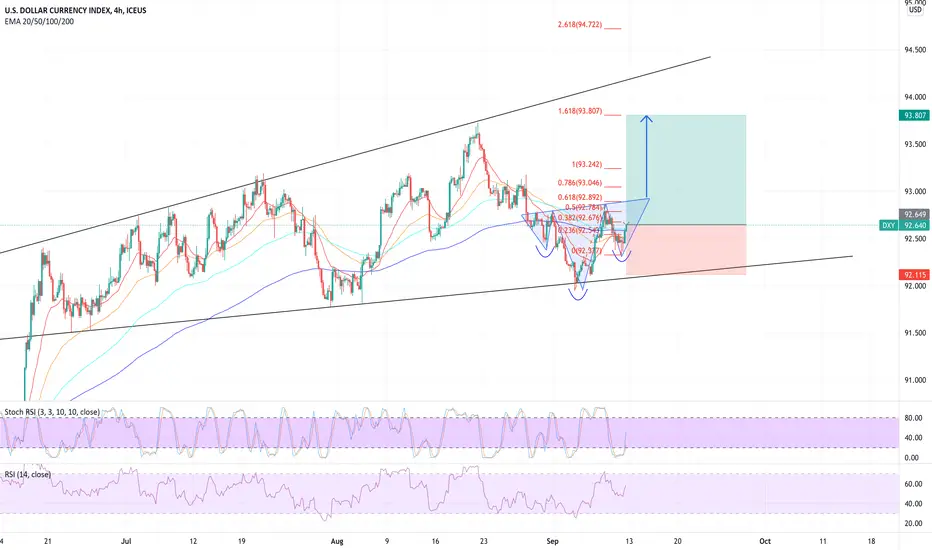
A Bullish H&S has developed on the hourly chart on the DXY which I believe will lead to a further leg down in the precious metals before the final move up.
In addition to that I believe that the DXY will correlate with the continuation of the market correction.
The 1.618 fib level of the Tred-Based Fib Extension also lands perfectly on the usual target of the H&S which is the price difference between the head and the low point of either shoulder.
In addition to that I believe that the DXY will correlate with the continuation of the market correction.
The 1.618 fib level of the Tred-Based Fib Extension also lands perfectly on the usual target of the H&S which is the price difference between the head and the low point of either shoulder.
Note
This is the monthly view (from 1986) Note
Weekly -Note
This is how it looks on the weekly. Made a double bottom back in late May with positive bullish RSI divergence on a 12 year key level (light red) from which we are yet to see a significant move - It might just soon come.
This will at least touch the 200EMA indicator on the weekly.
Trade active
Looking good, not a long way away from my targetTrade closed: target reached
Target reached!Disclaimer
The information and publications are not meant to be, and do not constitute, financial, investment, trading, or other types of advice or recommendations supplied or endorsed by TradingView. Read more in the Terms of Use.
Disclaimer
The information and publications are not meant to be, and do not constitute, financial, investment, trading, or other types of advice or recommendations supplied or endorsed by TradingView. Read more in the Terms of Use.