USD Index (DXY) 2H Chart Analysis:
📈 Trend:
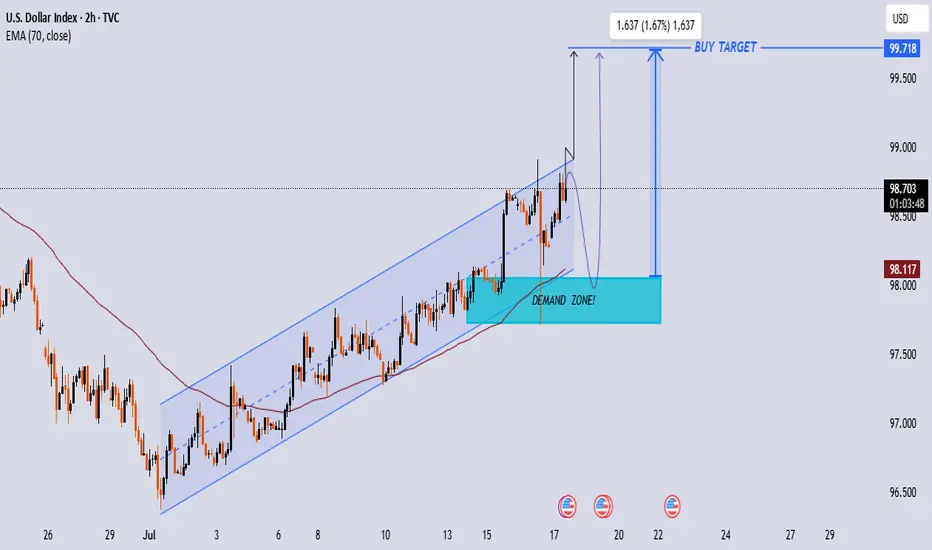
The price is moving in a strong ascending channel, respecting both upper and lower trendlines. Current price: 98.690.
📊 Strategies Used:
1. EMA Strategy (70 EMA):
Price is trading above the 70 EMA (98.116), indicating a bullish trend.
2. Demand Zone:
A clear demand zone is marked between 98.00–98.20. Price is expected to retest this zone before bouncing higher.
3. Chart Pattern (Bullish Flag):
A small correction (flag) is expected after the recent spike, which aligns with a bullish continuation.
4. Buy Setup:
Entry: Near 98.00–98.20 (Demand Zone)
Target: 99.718
Risk/Reward: High R:R with minimal risk near demand zone.
🔍 Conclusion:
Wait for a pullback to the Demand Zone. If confirmed with bullish price action, it offers a solid long entry toward the Buy Target at 99.718. Trend, EMA, zone, and breakout structure support bullish continuation.
🎯 Bias: Bullish
📈 Trend:
The price is moving in a strong ascending channel, respecting both upper and lower trendlines. Current price: 98.690.
📊 Strategies Used:
1. EMA Strategy (70 EMA):
Price is trading above the 70 EMA (98.116), indicating a bullish trend.
2. Demand Zone:
A clear demand zone is marked between 98.00–98.20. Price is expected to retest this zone before bouncing higher.
3. Chart Pattern (Bullish Flag):
A small correction (flag) is expected after the recent spike, which aligns with a bullish continuation.
4. Buy Setup:
Entry: Near 98.00–98.20 (Demand Zone)
Target: 99.718
Risk/Reward: High R:R with minimal risk near demand zone.
🔍 Conclusion:
Wait for a pullback to the Demand Zone. If confirmed with bullish price action, it offers a solid long entry toward the Buy Target at 99.718. Trend, EMA, zone, and breakout structure support bullish continuation.
🎯 Bias: Bullish
join my tellegram channel
t.me/JaMesGoldFiGhteR786
join my refferal broker
one.exnesstrack.org/a/g565sj1uo7?source=app
t.me/JaMesGoldFiGhteR786
join my refferal broker
one.exnesstrack.org/a/g565sj1uo7?source=app
Related publications
Disclaimer
The information and publications are not meant to be, and do not constitute, financial, investment, trading, or other types of advice or recommendations supplied or endorsed by TradingView. Read more in the Terms of Use.