Summary:
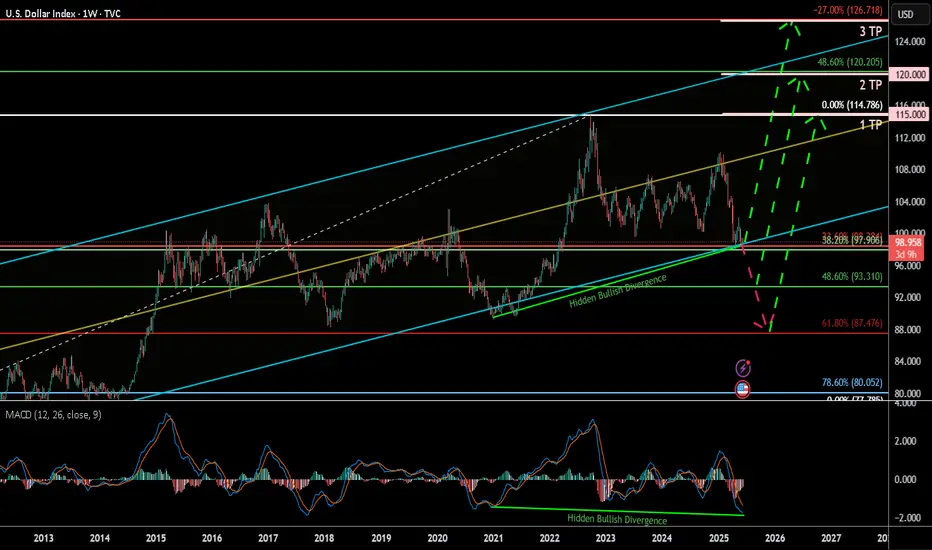
The U.S. Dollar Index (DXY) has corrected down to the key 38.60% Fibonacci retracement zone and is currently showing signs of a potential bullish reversal, bolstered by a clear hidden bullish divergence on the MACD. This may signal a renewed rally toward key upside targets, especially if the 93.3–99.9 support Zone holds.
Chart Context:
Current Price: 98.864
Key Fib Support: 38.60% @ 99.906, 48.60% @ 93.310, 61.80% @ 87.476
Support Zone: 93.3–99.9 USD
Hidden Bullish Divergence: Observed both in 2021 and now again in 2025 on the MACD
Trendline Support: Long-term ascending trendline holding since 2011
Fib Extension Targets (Trend-Based):
TP1: 115.000
TP2: 120.000
TP3: 126.666
Key Technical Observations:
Fibonacci Confluence: DXY is bouncing from a strong Fib cluster between 93.310 and 99.906, historically acting as a reversal zone.
Hidden Bullish Divergence: Suggests potential upside despite price weakness.
Downtrend Retest: Price may revisit 93.3–87.4 before confirming full reversal.
Breakout Pathway: Green dashed arrows outline the likely recovery trajectory toward 114–126 range.
Indicators:
MACD: Showing hidden bullish divergence and potential signal crossover.
Trendline Support: Holding intact from 2021 low.
Fib Levels: Used for retracement and trend-based extension.
Fundamental Context:
Interest Rate Outlook: If U.S. inflation remains controlled and Fed signals future hikes or sustained high rates, DXY strength may persist.
Global Liquidity & Recession Risk: If risk aversion returns, the dollar may rise as a safe haven.
Geopolitical Risks: Conflicts, trade tensions, or BRICS dedollarization efforts may create volatility.
Our Recent research suggests the Fed may maintain higher-for-longer rates due to resilient labor markets and sticky core inflation. This supports bullish USD bias unless macro shifts rapidly.
Why DXY Could Continue Strengthening:
Robust U.S. economic performance & monetary policy divergence
U.S. GDP growth (~2.7% in 2024) outpaces developed peers (~1.7%), supporting stronger USD
The Fed maintains restrictive rates (4.25–4.50%), while the ECB pivots to easing, widening the policy and yield gap .
Inflation resilience and Fed hawkishness
Labor markets remain tight, keeping inflation “sticky” and delaying expected rate cuts; market-implied cuts for 2025 have been pushed into 2026
Fed officials (e.g. Kugler) emphasize ongoing tariff-driven inflation, suggesting rates will stay elevated.
Safe-haven and yield-seeking capital flows
With global risks, capital favors USD-denominated assets for yield and stability
Why the Dollar Might Face Headwinds
Fiscal expansion & trade uncertainty
Ballooning U.S. deficits (~$3.3 trn new debt) and erratic tariff policy undermine confidence in USD
Wall Street’s consensus bearish position.
Major banks largely expect a weaker dollar through 2025–26. However, this crowded bearish sentiment poses a risk of a sharp rebound if data surprises occur
barons
Tariff policy risks
Trump's new tariffs could dampen dollar demand—yet if perceived as fiscal stimulus, they could unexpectedly buoy the USD .
Synthesis for Our Biases
A bullish DXY thesis is well-supported by:
Economic and policy divergence (U.S. growth + Fed vs. peers).
Hawkish Fed commentary and sticky inflation.
Safe-haven capital inflows.
Conversely, risks include:
Deteriorating fiscal/trade dynamics.
Potential Fed pivot once inflation shows clear decline.
A consensus that could trigger a short squeeze or reversal if overstretched.
Philosophical / Narrative View:
The dollar remains the world’s dominant reserve currency. Periodic dips often act as strategic re-accumulation phases for institutional capital—especially during global macro uncertainty. A return toward 120+ reflects this persistent demand for USD liquidity and safety.
Bias & Strategy Implication:
1. Primary Bias: Bullish, contingent on support at 93.3–99.9 holding.
2. Risk Scenario: Breakdown below 93.3 invalidates bullish thesis and targets 87.4–80 zones.
Impact on Crypto & Gold and its Correlation and Scenarios:
Historically, DXY has had an inverse correlation to both gold and crypto markets. When DXY strengthens, liquidity tends to rotate into dollar-denominated assets and away from risk-on trades like crypto and gold. When DXY weakens, it typically acts as a tailwind for both Bitcoin and gold.
Correlation Coefficients:
DXY vs. Gold: ≈ -0.85 (strong inverse correlation)
DXY vs. TOTAL (crypto market cap): ≈ -0.72 (moderate to strong inverse correlation)
Scenario 1: DXY Rallies toward 115–126 then, Expect gold to correct or stagnate, especially if yields rise. Crypto likely to pull back or remain suppressed unless specific bullish catalysts emerge (e.g., ETF flows or tech adoption).
Scenario 2: DXY ranges between 93–105 then Gold may consolidate or form bullish continuation patterns. Then Crypto may see selective strength, particularly altcoins, if BTC.D declines.
Scenario 3: DXY falls below 93 and toward 87 Then Gold likely to rally, possibly challenging all-time highs. Crypto could enter a major bull run, led by Bitcoin and followed by altcoins, fueled by increased liquidity and lower opportunity cost of holding non-USD assets.
Understanding DXY’s direction provides valuable insight for portfolio positioning in macro-sensitive assets.
Notes & Disclaimers:
This analysis reflects a technical interpretation of the DXY index and is not financial advice. Market conditions may change based on unexpected macroeconomic events, Fed policy, or geopolitical developments.
Related publications
Disclaimer
The information and publications are not meant to be, and do not constitute, financial, investment, trading, or other types of advice or recommendations supplied or endorsed by TradingView. Read more in the Terms of Use.
Related publications
Disclaimer
The information and publications are not meant to be, and do not constitute, financial, investment, trading, or other types of advice or recommendations supplied or endorsed by TradingView. Read more in the Terms of Use.