✨ Comprehensive and Engaging Technical Analysis:
DYDX/USDT is entering a highly compelling technical phase, showing signs of a potential trend reversal after breaking out from a prolonged accumulation zone that lasted nearly 5 months. This breakout on the daily timeframe (1D) is a classic early signal for a major upward move — often favored by swing traders and mid-term investors.
🔍 Accumulation Zone & Fibonacci Golden Pocket
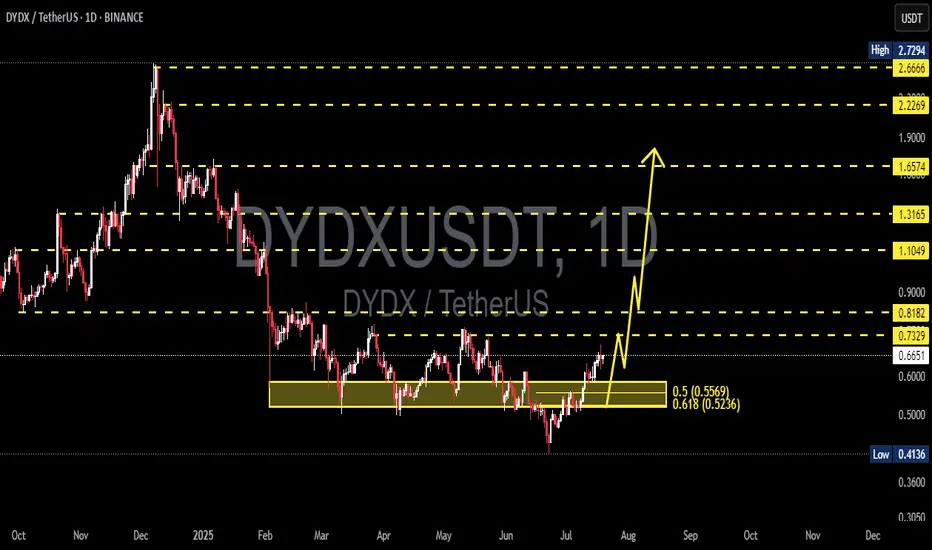
The range between $0.52 and $0.56 represents the Fibonacci retracement levels of 0.5 and 0.618 — commonly referred to as the "golden pocket".
This area historically acts as a strong accumulation zone, where institutional players often enter the market.
Multiple rejections and support confirmations within this zone reinforce its significance.
📈 Structure Breakout:
DYDX has officially broken above the horizontal structure near $0.6566 and further confirmed momentum beyond $0.7329.
The price action is forming a Double Bottom Pattern and potentially an Inverted Head & Shoulders, both of which are high-conviction bullish reversal patterns.
✅ Bullish Scenario (Primary Bias):
As long as DYDX holds above the $0.66–$0.73 breakout range, it remains on track for a significant bullish impulse. Key upside targets include:
Target (Resistance) Significance
$0.8182 Minor horizontal resistance
$1.1049 Key level from prior supply zone
$1.3165 Previous major reaction area
$1.6574 Multi-timeframe major resistance
$2.2269 – $2.6666 Fibonacci extension & historical distribution zone
$2.7294 Previous all-time high
💡 This structure offers a potential upside of over +200% if fully played out.
❗ Bearish Scenario (Alternative):
A failed retest and drop below $0.6566 would suggest a false breakout.
A breakdown below $0.52 would invalidate the bullish setup and could send DYDX back to $0.41, its previous macro support.
In this case, the market may re-enter a range-bound or sideways phase.
⚙️ Conclusion & Trading Strategy:
DYDX/USDT is at a technically critical moment. The recent breakout could mark the beginning of a major reversal trend after months of consolidation. A healthy pullback to the $0.66–$0.73 zone could offer an ideal entry opportunity with tight stop-losses.
For swing traders and trend followers, this may be one of the best risk/reward setups on DYDX in recent months.
#DYDXUSDT #DYDXBreakout #CryptoBullish #AltcoinSeason #CryptoAnalysis #FibonacciLevels #SmartMoney #DYDXRally #TechnicalBreakout
DYDX/USDT is entering a highly compelling technical phase, showing signs of a potential trend reversal after breaking out from a prolonged accumulation zone that lasted nearly 5 months. This breakout on the daily timeframe (1D) is a classic early signal for a major upward move — often favored by swing traders and mid-term investors.
🔍 Accumulation Zone & Fibonacci Golden Pocket
The range between $0.52 and $0.56 represents the Fibonacci retracement levels of 0.5 and 0.618 — commonly referred to as the "golden pocket".
This area historically acts as a strong accumulation zone, where institutional players often enter the market.
Multiple rejections and support confirmations within this zone reinforce its significance.
📈 Structure Breakout:
DYDX has officially broken above the horizontal structure near $0.6566 and further confirmed momentum beyond $0.7329.
The price action is forming a Double Bottom Pattern and potentially an Inverted Head & Shoulders, both of which are high-conviction bullish reversal patterns.
✅ Bullish Scenario (Primary Bias):
As long as DYDX holds above the $0.66–$0.73 breakout range, it remains on track for a significant bullish impulse. Key upside targets include:
Target (Resistance) Significance
$0.8182 Minor horizontal resistance
$1.1049 Key level from prior supply zone
$1.3165 Previous major reaction area
$1.6574 Multi-timeframe major resistance
$2.2269 – $2.6666 Fibonacci extension & historical distribution zone
$2.7294 Previous all-time high
💡 This structure offers a potential upside of over +200% if fully played out.
❗ Bearish Scenario (Alternative):
A failed retest and drop below $0.6566 would suggest a false breakout.
A breakdown below $0.52 would invalidate the bullish setup and could send DYDX back to $0.41, its previous macro support.
In this case, the market may re-enter a range-bound or sideways phase.
⚙️ Conclusion & Trading Strategy:
DYDX/USDT is at a technically critical moment. The recent breakout could mark the beginning of a major reversal trend after months of consolidation. A healthy pullback to the $0.66–$0.73 zone could offer an ideal entry opportunity with tight stop-losses.
For swing traders and trend followers, this may be one of the best risk/reward setups on DYDX in recent months.
#DYDXUSDT #DYDXBreakout #CryptoBullish #AltcoinSeason #CryptoAnalysis #FibonacciLevels #SmartMoney #DYDXRally #TechnicalBreakout
✅ Get Free Signals! Join Our Telegram Channel Here: t.me/TheCryptoNuclear
✅ Twitter: twitter.com/crypto_nuclear
✅ Join Bybit : partner.bybit.com/b/nuclearvip
✅ Benefits : Lifetime Trading Fee Discount -50%
✅ Twitter: twitter.com/crypto_nuclear
✅ Join Bybit : partner.bybit.com/b/nuclearvip
✅ Benefits : Lifetime Trading Fee Discount -50%
Disclaimer
The information and publications are not meant to be, and do not constitute, financial, investment, trading, or other types of advice or recommendations supplied or endorsed by TradingView. Read more in the Terms of Use.