Life is simple...Trade with Simplicity!
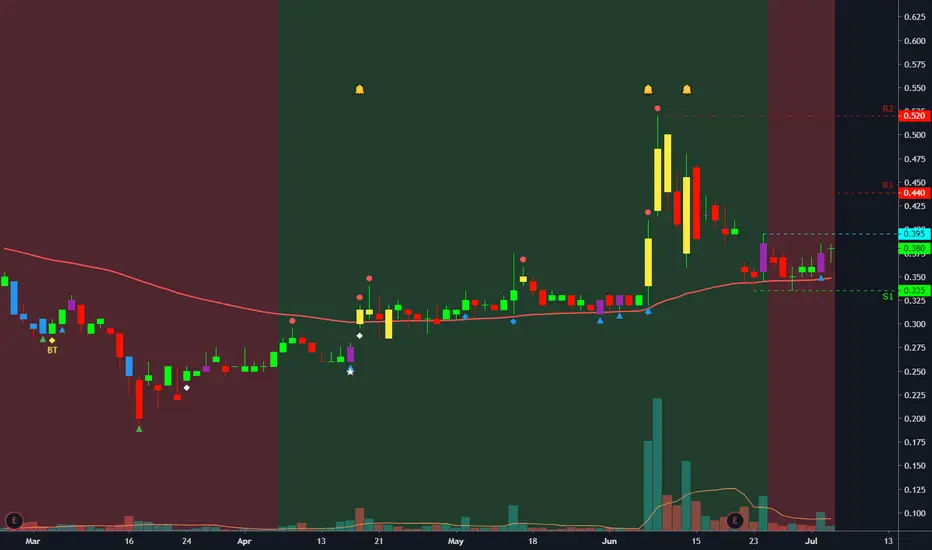
*Trend direction: UPTREND - (Higher-High & Higher Low was observed)
*The price was pullback and supported twice at our lifeline (Redlin), on 23 & 29-Jun.
*Turning points (Purple-candle) have appeared on 24-Jun & 2-Jul an indication of the price reversal to upward direction.
Prediction: Sideways and prepare to move upward.
Once it breaks the immediate resistance R0.395 it will take-off to the next level.
*Otherwise, it will hover sideways of the range between 0.385-0.315 within a BOX pattern.
Preference Strategy: Swing trading (Follow the BUY/SELL Signal respectively).
Target Price: R1=0.44-0.48, R2=0.52-0.55
Support/Cut Loss: S1=0.335
*Reminder TP & CL is an individual preference & decision. No fixed rule or guideline for it...Trade at your own risk.
Signal's Interpretation:
BUY Signal:-
*Green-Background = Indication of an Uptrend
*BT-Yellow-Diamond = Indication of Bottom signal.
*Green-Upward-Triangle = Indication of Hot-seller, potentially a Bottom signal.
*White-Diamond = Indication of a strong upward momentum accelerator.
*Purple-Candle = Indication of a strong turning point or a trend reversal.
*Yellow-Candle + Alert-Bell = Indication of Price take-off area.
SELL Signal:-
*Red-Background = Indication of a Downtrend.
*Red-Dot = Indication of Hot-buyer, potentially a Top signal.
*Blue-Candle = Indication of Price selling off area.
Trade active
As per our prediction, EG hit our R1 0.44-48 perfectly. *Some profit-taking activities will take place.The rally is still intact as it has exhibited the take-off zone signal (Yellow-candle + Bell alert).
Any pullback is an opportunity for entry.
Good luck & Happy Trading!
Trade closed: target reached
EG, it reached our R0.55 and beyond our expectations. Now it is going into a big correction. We have closed our position as an objective accomplished.Disclaimer: This is not a Buy or Sell suggestion but solely sharing information. Trade at your own risk.
Good luck & Happy Trading!
Our Contact, Member area & Stock Alert Channel:-
Telegram: t.me/Simply_Is_Beauty
Member area: tradingview.com/chart/HLT/KiV99M8s-ASAS-Member-Area/
Join our Automated Signal Alert System channel for KLSE.
*Request via Telegram
Telegram: t.me/Simply_Is_Beauty
Member area: tradingview.com/chart/HLT/KiV99M8s-ASAS-Member-Area/
Join our Automated Signal Alert System channel for KLSE.
*Request via Telegram
Disclaimer
The information and publications are not meant to be, and do not constitute, financial, investment, trading, or other types of advice or recommendations supplied or endorsed by TradingView. Read more in the Terms of Use.