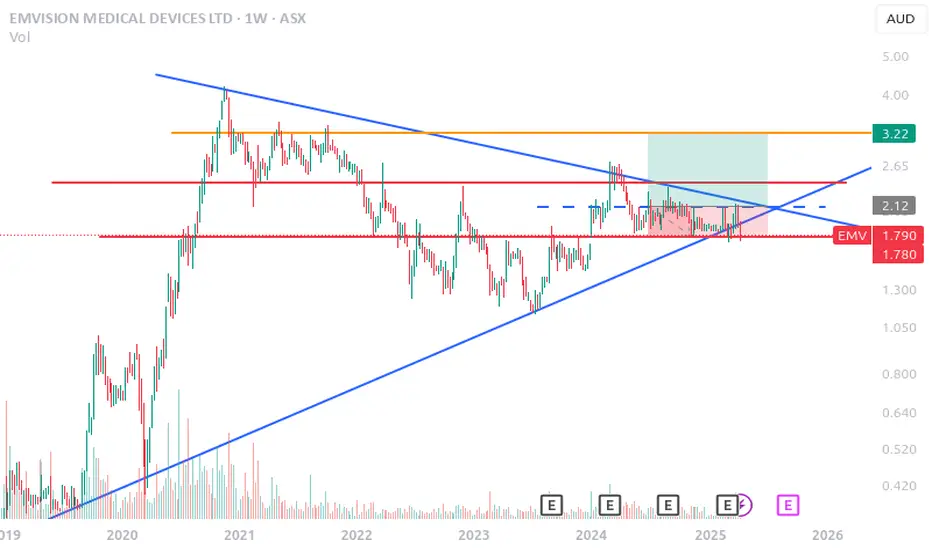
To be honest this chart looks weak, but I've seen charts like this with this kind of setup pop, so I might put it on a watchlist. The large triangle has caputured the trade with the lower bound trendline being far steep than the upper. This sort of indicates that there is a good amount of demand underneath this stock, however since about the start of 2024 it really looks to be a bit weaker. This is indicated by most of the price action being close to the lower blue support level, and the price being sold down almost immediately once it hits the upper blue resistance level.
The price action has to hold this 1.75 level otherwise it will likely drop sharply. We have very low volume being traded at the moment although the last few weeks there has been higher than average volume. This will hopefully keep the level. Before this chart can turn bullish it has to break 2.10, possibly reach 2.40, at which point it should retest 2.10. If the 2.10 level can be maintained on a retest then I would say that this chart is bullish and is worth a buy. Which would make for a good trade, as the first target is 3.20, and the stop is 1.75. Meaning a 15% risk for an initial 55% gain.
The price action has to hold this 1.75 level otherwise it will likely drop sharply. We have very low volume being traded at the moment although the last few weeks there has been higher than average volume. This will hopefully keep the level. Before this chart can turn bullish it has to break 2.10, possibly reach 2.40, at which point it should retest 2.10. If the 2.10 level can be maintained on a retest then I would say that this chart is bullish and is worth a buy. Which would make for a good trade, as the first target is 3.20, and the stop is 1.75. Meaning a 15% risk for an initial 55% gain.
Disclaimer
The information and publications are not meant to be, and do not constitute, financial, investment, trading, or other types of advice or recommendations supplied or endorsed by TradingView. Read more in the Terms of Use.
Disclaimer
The information and publications are not meant to be, and do not constitute, financial, investment, trading, or other types of advice or recommendations supplied or endorsed by TradingView. Read more in the Terms of Use.