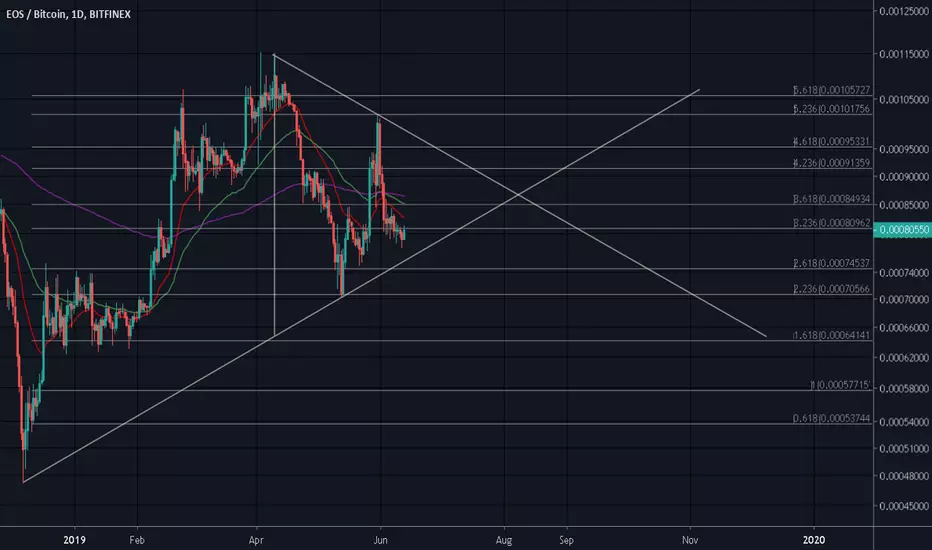
On 1 Day timeframe

DMI , DMX(strenght momentum) is fallen sharply while dmi+(green line/bullish trend) below dmi- (red line/bearish trend) and still closing with each other indicate a bearish momentum is slight dominate over bullish trend with low strenght currently.
MACD, macd line and signal line is get rejected back to bearish area although the seller histogram is decreasing it's strength and ready to switch into buyer histogram near future.
This 'potential' symmetrical triangle will be invalidated once the price action by prolonged side ways movement.
Peace
Note
- Short term bounce is expected from the way of indicators look. stochastic is bottom out. Slight bullish divergence between histogram seller and price action as it's made a lower low but a higher low in buyer histogram MACD.
while overall trend is still bearish from DMI indicator
Disclaimer
The information and publications are not meant to be, and do not constitute, financial, investment, trading, or other types of advice or recommendations supplied or endorsed by TradingView. Read more in the Terms of Use.
Disclaimer
The information and publications are not meant to be, and do not constitute, financial, investment, trading, or other types of advice or recommendations supplied or endorsed by TradingView. Read more in the Terms of Use.