This is a Daily chart I have been tracking for some time using HTF Balance Ranges and Structure, it may or not play out and if it does then I would think this back fill/correction can take a long time to play out, I would say over a year+ so this is not for day trading or short term swing trading but it is something to possibly keep in mind and help track our movement with IF THEN statements and potential targets lower. 4800 area is something I have been tracking for a while that is an area to me that start our whole move which brought us here and I would not be surprised if we tried to back fill at least most of the way towards it. Again this can take a long time to play out but at least something to refer to in order to manage expectations for new highs and areas of interest for the market.
Not much else to say I tried to make notes on the chart it self so its easier to track.
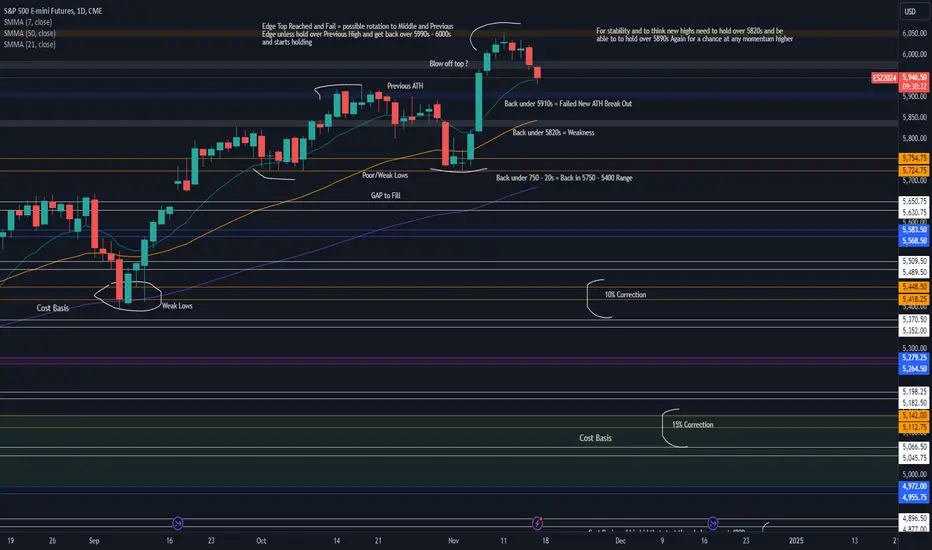
For stability in the market we would need to not get back under 5820s - 5750/20s Areas and build bases over it then get back over 5990 - 6000 to think new highs, until then we could keep building supply and moving it to lower targets.
For Day Trading refer to Weekly Day Trading Plans.
Not much else to say I tried to make notes on the chart it self so its easier to track.
For stability in the market we would need to not get back under 5820s - 5750/20s Areas and build bases over it then get back over 5990 - 6000 to think new highs, until then we could keep building supply and moving it to lower targets.
For Day Trading refer to Weekly Day Trading Plans.
Note
Correction % were recalculated after contract roll gave new high but idea stayed the same. Move started when we finally got under MAs held and got a trend change, from there we tracked each section to the downside for continuation as trend remained down. We are now back in 5750 - 5400 Daily Range and have pushed inside its Value, got 10% correction tagged. As long as we stay under 750s - 820s lower targets will remain in play BUT this can take time as we are now inside Value and price could balance between VAL - Mean - VAH with pushes out of Value possibly finding their way back in. This month made a huge move already, of course we could have more in the tank but need to watch out for things to tighten up and find some balance. 10% is area under the Daily Mean 5550s +/- 15% would be down in lower range around 5260s above bigger cost basis.Note
Bump, lower Daily Edge of this 750 - 5420 Range taggedNote
Bump, 15% correction area reached Note
Range edge to edge played out in one day, don't see that often. Tag Note
Guess big bid was still at 4800s Disclaimer
The information and publications are not meant to be, and do not constitute, financial, investment, trading, or other types of advice or recommendations supplied or endorsed by TradingView. Read more in the Terms of Use.
Disclaimer
The information and publications are not meant to be, and do not constitute, financial, investment, trading, or other types of advice or recommendations supplied or endorsed by TradingView. Read more in the Terms of Use.