---- Short-term Analysis for the next coming 1 to 3 Weeks - Based on 3h Chart -------
ETH/USDT: Selling area reached - direct drop expected
Context
The Global Crypto market leads by BTC and ETH is still evolving within a bearish market configuration. the actual bounce offers a sell opportunity
N.B => The ETH is actually underperforming BTC, it means that the drop expected on ETH will be stronger than BTC
Market configuration
- Graphical Elements :
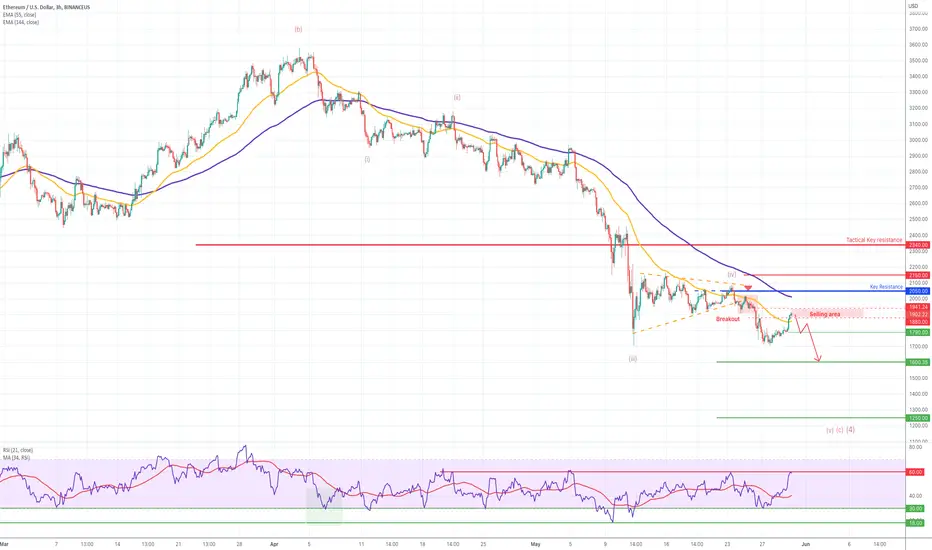
Graphical Resistance = 2050 & 2340
- Mathematical Indicators:
EMA ( Exp Moving averages) are still in bearish configuration
RSI indicator (below) is close to resistance = end of bounce
- Elliot & Harmonic Wave (Fibonacci):
A last drop to draw the wave (v) (c) (4) is missing - the market is actually drawing the wave (v)
Fibonacci resistance in the current wave (v) = 2050
Fibonacci support of the wave 5 C (4) = 1600 and in extension 1250
Fibonacci short-term wave = 1790
Conclusion
Prefered case => The ETH is expecting to be sold in the coming days as long as 2050 remains a resistance valid - the selling area has been reached and a new drop towards 1790/1600 Is expected
Alternative case => The ETH bounce above 2050. a larger rise towards 2150 and 2340 the Tactical resistance will be validated. Note the 2340 is the actual equivalent of 34000, in this scenario a recovery on ETH/BTC rate = ETH outperformance will conduct to align ETH and BTC performance.
ETH/USDT: Selling area reached - direct drop expected
Context
The Global Crypto market leads by BTC and ETH is still evolving within a bearish market configuration. the actual bounce offers a sell opportunity
N.B => The ETH is actually underperforming BTC, it means that the drop expected on ETH will be stronger than BTC
Market configuration
- Graphical Elements :
Graphical Resistance = 2050 & 2340
- Mathematical Indicators:
EMA ( Exp Moving averages) are still in bearish configuration
RSI indicator (below) is close to resistance = end of bounce
- Elliot & Harmonic Wave (Fibonacci):
A last drop to draw the wave (v) (c) (4) is missing - the market is actually drawing the wave (v)
Fibonacci resistance in the current wave (v) = 2050
Fibonacci support of the wave 5 C (4) = 1600 and in extension 1250
Fibonacci short-term wave = 1790
Conclusion
Prefered case => The ETH is expecting to be sold in the coming days as long as 2050 remains a resistance valid - the selling area has been reached and a new drop towards 1790/1600 Is expected
Alternative case => The ETH bounce above 2050. a larger rise towards 2150 and 2340 the Tactical resistance will be validated. Note the 2340 is the actual equivalent of 34000, in this scenario a recovery on ETH/BTC rate = ETH outperformance will conduct to align ETH and BTC performance.
Trade closed: target reached
Target reachedBullish reversal expected between 12500 and 1600
CIO & Head of market research (Automata - Vancelian)
vancelian.com/en
vancelian.com/en
Disclaimer
The information and publications are not meant to be, and do not constitute, financial, investment, trading, or other types of advice or recommendations supplied or endorsed by TradingView. Read more in the Terms of Use.