Ethereum (ETH/USD) 4H Analysis – Bullish Setup
Chart technical analysis breakdown:
Current Price
$2,971.59
Pattern
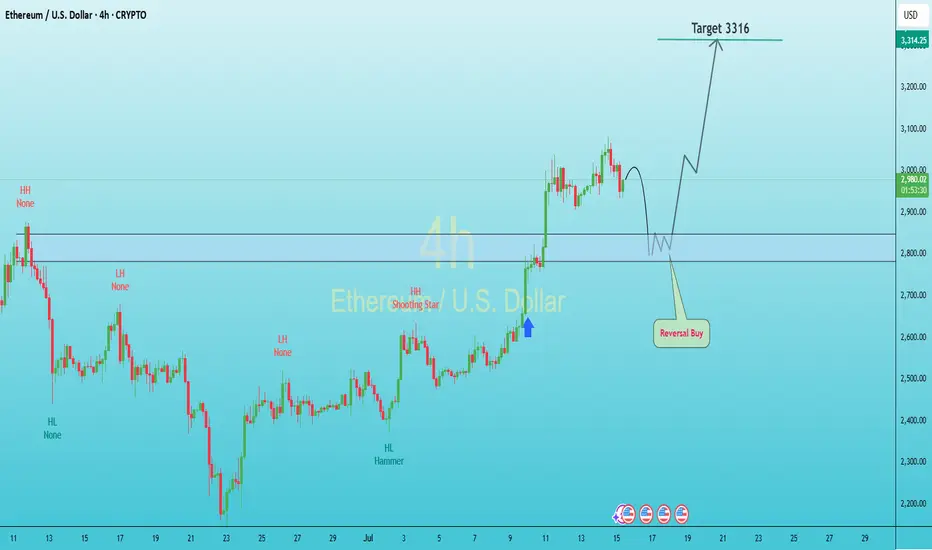
Price is currently in a bullish correction phase after a recent high.
A potential "Reversal Buy" zone is identified between $2,800–$2,850, suggesting the area is a strong support zone.
Market structure shows higher highs (HH) and higher lows (HL) indicating a bullish trend.
Entry Zone
Reversal Buy Area: Around $2,800–$2,850
This is where the chart expects price to bottom out and reverse upward.
Target (TP)
Primary Take Profit (TP):
🎯 $3,316 – Strong resistance and price target.
Stop Loss (SL)
Below the reversal zone:
❌ Suggested SL around $2,730–2,750 to protect against downside break.
Conclusion
Wait for price to dip into the $2,800–2,850 zone and show signs of bullish reversal (candlestick confirmation or bullish divergence).
Target the $3,316 level, with an SL below $2,750.
Risk-to-reward ratio is favorable if entry aligns near the support zone.
Chart technical analysis breakdown:
Current Price
$2,971.59
Pattern
Price is currently in a bullish correction phase after a recent high.
A potential "Reversal Buy" zone is identified between $2,800–$2,850, suggesting the area is a strong support zone.
Market structure shows higher highs (HH) and higher lows (HL) indicating a bullish trend.
Entry Zone
Reversal Buy Area: Around $2,800–$2,850
This is where the chart expects price to bottom out and reverse upward.
Target (TP)
Primary Take Profit (TP):
🎯 $3,316 – Strong resistance and price target.
Stop Loss (SL)
Below the reversal zone:
❌ Suggested SL around $2,730–2,750 to protect against downside break.
Conclusion
Wait for price to dip into the $2,800–2,850 zone and show signs of bullish reversal (candlestick confirmation or bullish divergence).
Target the $3,316 level, with an SL below $2,750.
Risk-to-reward ratio is favorable if entry aligns near the support zone.
Trade closed: target reached
Congratulations target successful JOIN MY TELEGRAM:
FREE SIGNALS TECHNICAL CHART AND EDUCATOIN
t.me/+j_sv6p9sL5I0MDY0
FREE SIGNALS TECHNICAL CHART AND EDUCATOIN
t.me/+j_sv6p9sL5I0MDY0
Disclaimer
The information and publications are not meant to be, and do not constitute, financial, investment, trading, or other types of advice or recommendations supplied or endorsed by TradingView. Read more in the Terms of Use.
JOIN MY TELEGRAM:
FREE SIGNALS TECHNICAL CHART AND EDUCATOIN
t.me/+j_sv6p9sL5I0MDY0
FREE SIGNALS TECHNICAL CHART AND EDUCATOIN
t.me/+j_sv6p9sL5I0MDY0
Disclaimer
The information and publications are not meant to be, and do not constitute, financial, investment, trading, or other types of advice or recommendations supplied or endorsed by TradingView. Read more in the Terms of Use.