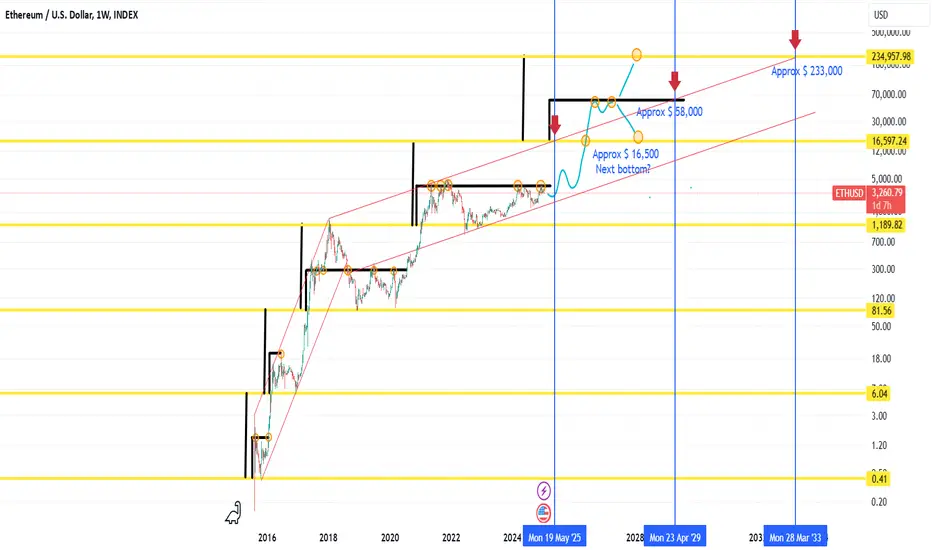
The graph speaks for itself, what I do is try to map recurring patterns. No emotion, no judgment, just numbers. What is striking is that the bottom increases by a factor of (approx) 13/14 each time. You also see that something remarkable happens from the bottom of a factor of (approx) 3.4: in 2016 it was a breakout moment, in 2016 it was the top and then breakout, in 2017 it consolidated around that level and then in 2019 and 2020 it was the local top and then breakout moment. In 2021 it was the local top (you can see it better on a daily level than on a weekly level) and in 2024 it was the local top a few times (again: you can see it a lot better on a daily level). If this trend continues, it would go through $16,500 at some point and that amount might later be the bottom. Looking at the previous patterns, it should shoot through to around $58,000. From that point on, it may seek the bottom of $16,500 or it shoots through to the now very unrealistic amount of $233,000. Mind you, this is looking at the very long term and assuming a stock market that I see topping around approx. 2030, it is not unrealistic that this is the final top for ethereum. Who knows.
Again, the recurring patterns are interesting. Don't hold me to decimals after the comma, the lines are always the same. I just copy/pasted the lines!
It is impossible to predict on what dates this will happen, but I was able to find some indication by looking at the channels ETH moves in. I wouldn't take this too seriously. It could happen sooner or later, I have no idea.
Disclaimer
The information and publications are not meant to be, and do not constitute, financial, investment, trading, or other types of advice or recommendations supplied or endorsed by TradingView. Read more in the Terms of Use.
Disclaimer
The information and publications are not meant to be, and do not constitute, financial, investment, trading, or other types of advice or recommendations supplied or endorsed by TradingView. Read more in the Terms of Use.