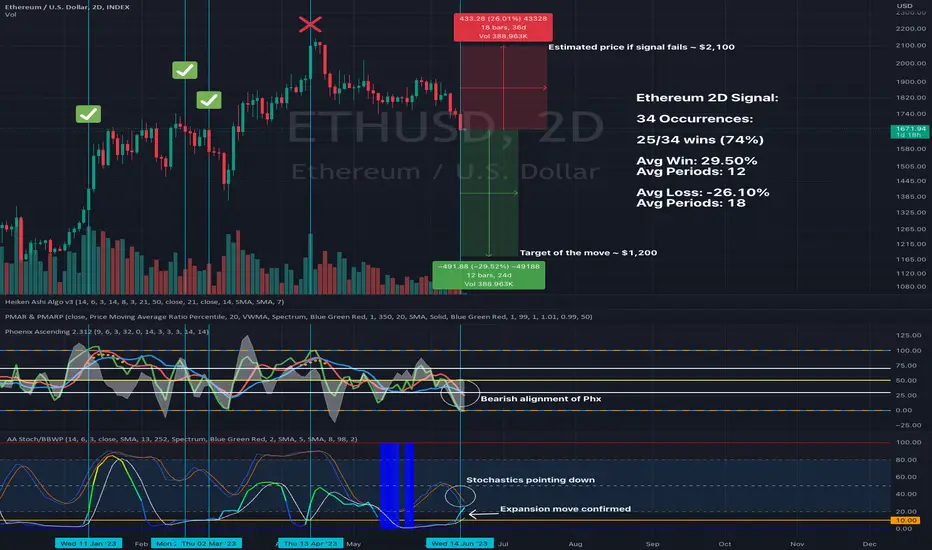
This is the 2Day #ETH chart analysing volatility vs momentum.
This signal has just confirmed, this bearish confirmation may see ETH move down to $1,200 over the few weeks.
This analysis has been quite accurate (74%) over the past 34 iterations, with the average move of the expansion phase being ~29.50% lasting just over three weeks.
*The moves are measured once the BBWP crosses above the orange horizontal line. *
Probability suggests that we will ETH fall to ~$1,200 (-29.50%) over the next 24 or so days. However, if this signal were to fail. Then, ETH may see rally up to April highs around $2,100.
The lack of liquidity can be seen as Bitcoin and Crypto has failed to make higher prices since April, whilst traditional markets such as the S&P 500 and DAX continue to rise.
See 'Total3' which shows money flowing out of altcoins and into Bitcoin, which is a bearish sign.
Disclaimer
The information and publications are not meant to be, and do not constitute, financial, investment, trading, or other types of advice or recommendations supplied or endorsed by TradingView. Read more in the Terms of Use.
Disclaimer
The information and publications are not meant to be, and do not constitute, financial, investment, trading, or other types of advice or recommendations supplied or endorsed by TradingView. Read more in the Terms of Use.