Ethereum (ETH/USD) Bullish Reversal Setup 🚀
📊 Chart Overview (2H Timeframe):
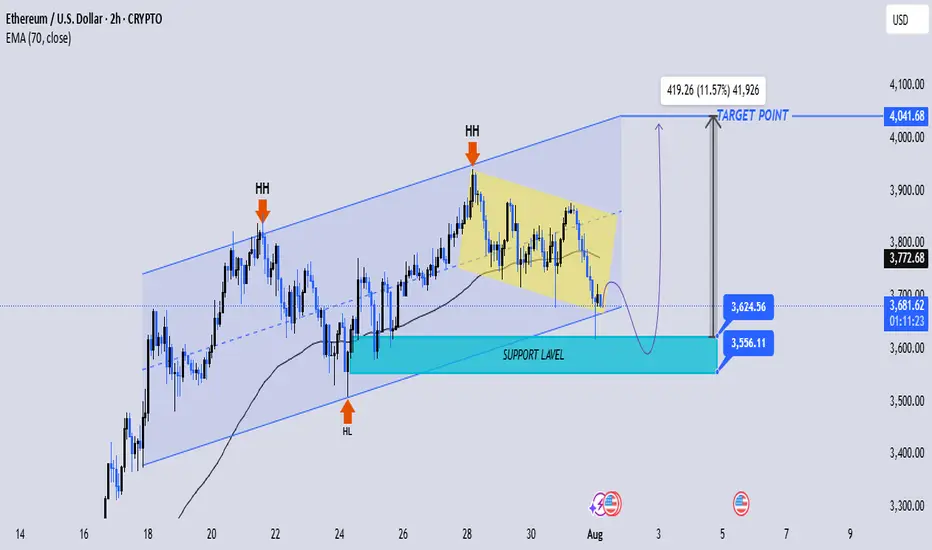
Price is moving within a rising channel 📈 showing an overall bullish trend.
Recently formed Higher Highs (HH) and Higher Lows (HL) indicating continued bullish structure.
Currently in a bullish flag (yellow channel), a consolidation pattern.
Price is approaching a strong support zone between $3,556 – $3,624, aligning with the lower trendline and near the 70 EMA.
📉 Possible Price Action:
Expecting a bounce from support zone, completing the flag pattern.
Targeting $4,041 (+11.57%) as the breakout move projection from the flag.
✅ Key Strategies Used:
Price Action (HH, HL, flag pattern)
Chart Pattern (Bullish flag)
Support/Resistance Zones
Trendline Analysis
EMA 70 dynamic support
🎯 Target Point: $4,041.68
🔄 Invalidation Below: $3,556
Conclusion: Watch for bullish confirmation at support for a potential breakout toward the $4,041 target.
📊 Chart Overview (2H Timeframe):
Price is moving within a rising channel 📈 showing an overall bullish trend.
Recently formed Higher Highs (HH) and Higher Lows (HL) indicating continued bullish structure.
Currently in a bullish flag (yellow channel), a consolidation pattern.
Price is approaching a strong support zone between $3,556 – $3,624, aligning with the lower trendline and near the 70 EMA.
📉 Possible Price Action:
Expecting a bounce from support zone, completing the flag pattern.
Targeting $4,041 (+11.57%) as the breakout move projection from the flag.
✅ Key Strategies Used:
Price Action (HH, HL, flag pattern)
Chart Pattern (Bullish flag)
Support/Resistance Zones
Trendline Analysis
EMA 70 dynamic support
🎯 Target Point: $4,041.68
🔄 Invalidation Below: $3,556
Conclusion: Watch for bullish confirmation at support for a potential breakout toward the $4,041 target.
join my tellegram channel
t.me/JaMesGoldFiGhteR786
join my refferal broker
one.exnesstrack.org/a/g565sj1uo7?source=app
t.me/JaMesGoldFiGhteR786
join my refferal broker
one.exnesstrack.org/a/g565sj1uo7?source=app
Related publications
Disclaimer
The information and publications are not meant to be, and do not constitute, financial, investment, trading, or other types of advice or recommendations supplied or endorsed by TradingView. Read more in the Terms of Use.