This ETH/USD (Ethereum to US Dollar) 1-hour chart outlines a bullish trade setup. Here's a breakdown of the analysis:
---
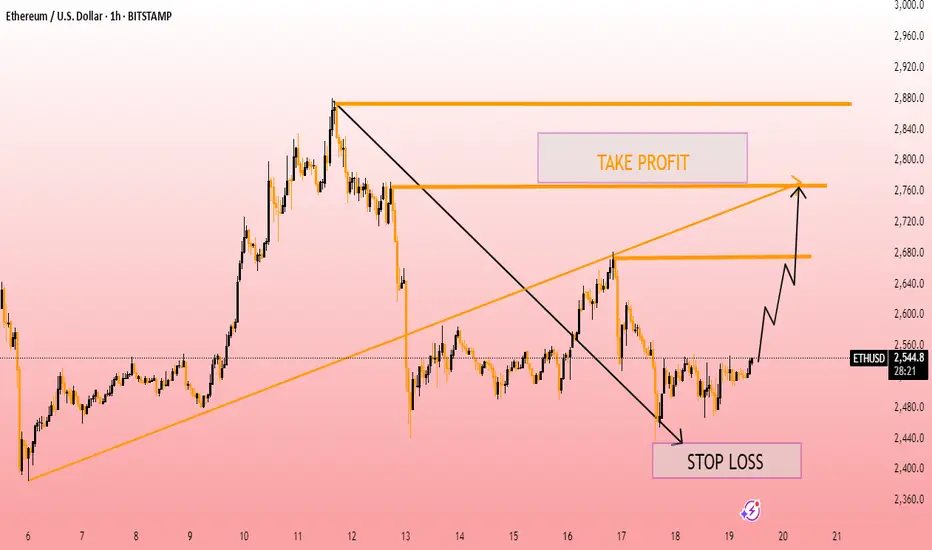
Chart Summary:
Current Price: ~$2,541.8
Bullish Projection: A move toward the $2,700–$2,800 range.
Take Profit Zone: Highlighted between $2,700 and $2,860, targeting a key resistance area.
Stop Loss: Marked below $2,440, just under recent support and the swing low.
Structure:
The price appears to have broken a descending trendline (black).
A potential higher low formation suggests bullish momentum.
Chart implies a possible breakout from a falling wedge pattern.
Mid-term target is a retest of a previous high around $2,860.
---
Trade Plan Based on the Chart:
Entry: Around the current price region ($2,540–$2,550), following the breakout.
Stop Loss: Below $2,440 to limit downside risk.
Take Profit: Targeting $2,700 initially, with a stretch goal near $2,860 if momentum continues.
---
Remarks:
Confirmation of bullish bias depends on breaking above $2,640–$2,680 resistance.
Volume confirmation and rejection of lower levels would further support the trade.
Consider potential volatility near resistance zones.
Would you like a detailed risk-to-reward ratio or a trading journal format for this setup?
---
Chart Summary:
Current Price: ~$2,541.8
Bullish Projection: A move toward the $2,700–$2,800 range.
Take Profit Zone: Highlighted between $2,700 and $2,860, targeting a key resistance area.
Stop Loss: Marked below $2,440, just under recent support and the swing low.
Structure:
The price appears to have broken a descending trendline (black).
A potential higher low formation suggests bullish momentum.
Chart implies a possible breakout from a falling wedge pattern.
Mid-term target is a retest of a previous high around $2,860.
---
Trade Plan Based on the Chart:
Entry: Around the current price region ($2,540–$2,550), following the breakout.
Stop Loss: Below $2,440 to limit downside risk.
Take Profit: Targeting $2,700 initially, with a stretch goal near $2,860 if momentum continues.
---
Remarks:
Confirmation of bullish bias depends on breaking above $2,640–$2,680 resistance.
Volume confirmation and rejection of lower levels would further support the trade.
Consider potential volatility near resistance zones.
Would you like a detailed risk-to-reward ratio or a trading journal format for this setup?
Disclaimer
The information and publications are not meant to be, and do not constitute, financial, investment, trading, or other types of advice or recommendations supplied or endorsed by TradingView. Read more in the Terms of Use.
Disclaimer
The information and publications are not meant to be, and do not constitute, financial, investment, trading, or other types of advice or recommendations supplied or endorsed by TradingView. Read more in the Terms of Use.