I posted a chart previously on Ethereum expecting a possible reversal and I was somewhat correct.
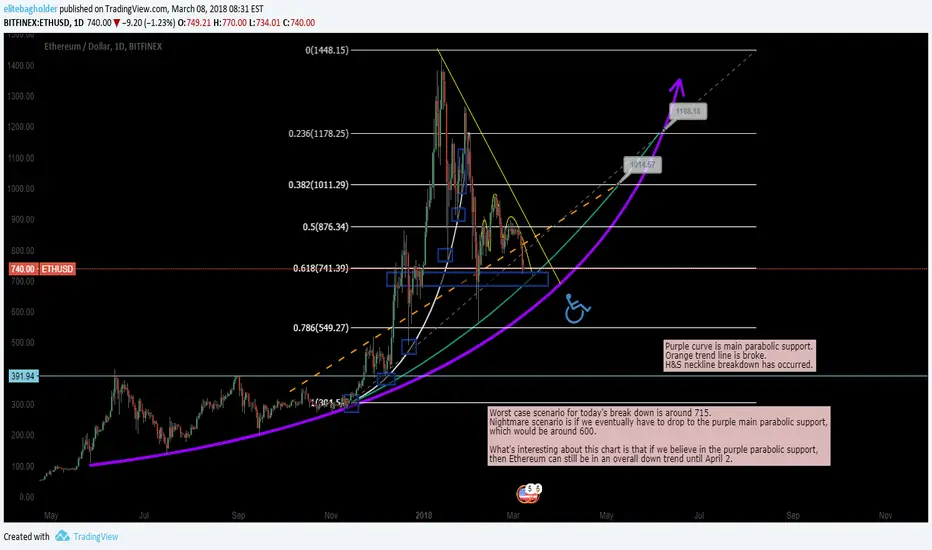
The H&S pattern brought it down below the neckline, just not exactly to my target.
Well, I am not a snob, and I fully understand that this could have happened because of the Binance "hack" that occurred which caused a sell off in the entire market.
But if I was looking at Ethereum's chart objectively right now, I'd have to say it COULD still go lower, but I just see too much support right beneath it.
If we believe in the parabolic blue support, and if we believe in the critical 0.618 Fibonacci level, and if we can see that there has been a tremendous amount of buy/sell activity around this level in the past, it's hard for me to be very bearish here. Could this be the moment we break the downtrend that has us trapped? Possible. I am not sure though.
There is still little buying activity in the market right now, but there are also less sellers.
Still Ethereum breaking 700 is a possibility, but I can't really picture a 600 or 650 break after this much progress. I feel we are exploring how low we can go, and we are getting closer and closer to our destination.
Usually only one thing can happen from there.
I don't have any particular advice on what to do, but buying here isn't a terrible decision. You will lose small or have a decent gain.
Massive drops are just usually irrational, just like how parabolic rises are usually irrational. Both cases get corrected quickly in this market.
Anyway, this isn't financial advice, you can agree or disagree with it.
Note
Note: The parabolic supports of Ethereum will be broken at one point in time except for the purple one. The purple one will just get adjusted, assuming we are long term bullish. At this point in time though, I don't feel like the blue/green parabolic support will break, it should take a few more stabs before it loses its support. Maybe in the coming months, just not now.Note
Well, it appears my chart is being challenged and Ethereum wants to pullback lower. The teal parabolic support is broken, but a bounce is still possible. Like I said, there was a lot of action in this area in the past.
1. if we approach 600-625, we are in pretty dangerous territory. We'd test my purple parabolic support.
2. Next stop would be testing the recent bottom around 565.
3. Then 500.
4. And then the support level that most likely cannot be broken - the 400 level.
At these levels it would make sense to scale in (consider buying) since they are crucial support levels and have the potential to cause a reversal.
My guess is 680 is our low for the time being, if that breaks then maybe I'll flip a coin on what happens next. ;)
Anyway, this isn't financial advice, you can agree or disagree with it.
Disclaimer
The information and publications are not meant to be, and do not constitute, financial, investment, trading, or other types of advice or recommendations supplied or endorsed by TradingView. Read more in the Terms of Use.
Disclaimer
The information and publications are not meant to be, and do not constitute, financial, investment, trading, or other types of advice or recommendations supplied or endorsed by TradingView. Read more in the Terms of Use.