📉 Trend Observation – Short-Term (2H)
❗ Current Market Structure:
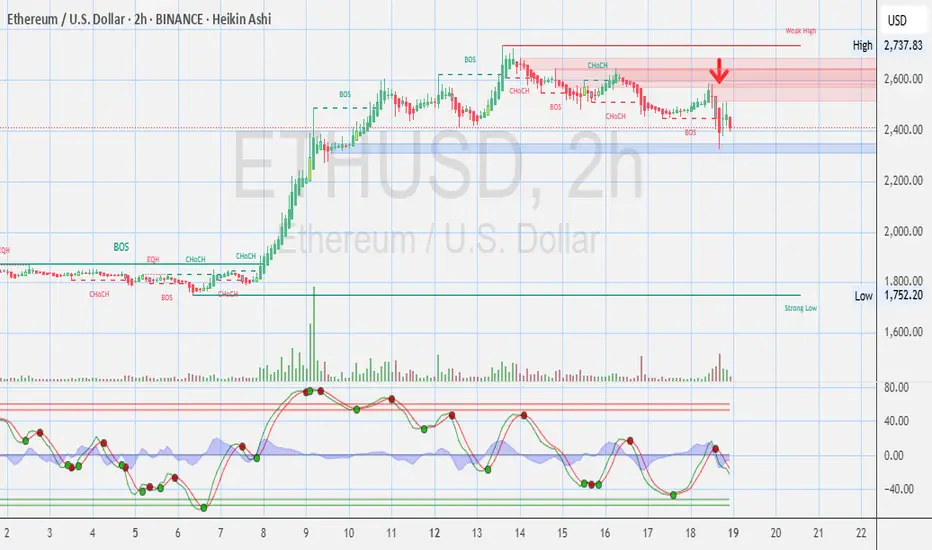
CHoCH (Change of Character) and BOS (Break of Structure) clearly show that the bullish momentum has broken down.
Price recently lost support at $2,500–$2,550, flipped that zone into resistance (highlighted red area), and dipped toward $2,400 and below.
You can see a bearish market structure forming with lower highs and lower lows.
🟣 Indicators (Stochastic RSI & RSI):
Stochastic RSI is in a bearish crossover and pointing downward, suggesting more downside pressure.
RSI is trending lower, confirming bearish momentum is in control short-term.
🔵 Support Zones:
Price bounced slightly near $2,390–$2,400, which is a minor support.
Major support lies around $2,200, and strong support can be seen at $1,750–$1,800, marked on the chart.
🔴 Resistance Zones:
Heavy resistance at $2,500–$2,600 (red supply zone).
Until ETH reclaims this zone with strength and volume, upside is capped.
🧭 Summary: Short-Term Bearish
Trend: Bearish (2H shows weakness; consistent lower highs/lows)
Momentum: Fading, with sellers in control
Volume: Increased on recent red candles → indicates pressure
💡 Should You Hold or Sell? Short-Term Traders (2H-1D):
⚠️ Consider waiting or trimming positions if you're leveraged or seeking short-term profit.
A better re-entry might come near $2,200 or even $1,750 if sell pressure increases.
-------------------------
Not for financial advise.
Not for recommendations to buy sell any crypto, security , or stocks.
Do your own research
❗ Current Market Structure:
CHoCH (Change of Character) and BOS (Break of Structure) clearly show that the bullish momentum has broken down.
Price recently lost support at $2,500–$2,550, flipped that zone into resistance (highlighted red area), and dipped toward $2,400 and below.
You can see a bearish market structure forming with lower highs and lower lows.
🟣 Indicators (Stochastic RSI & RSI):
Stochastic RSI is in a bearish crossover and pointing downward, suggesting more downside pressure.
RSI is trending lower, confirming bearish momentum is in control short-term.
🔵 Support Zones:
Price bounced slightly near $2,390–$2,400, which is a minor support.
Major support lies around $2,200, and strong support can be seen at $1,750–$1,800, marked on the chart.
🔴 Resistance Zones:
Heavy resistance at $2,500–$2,600 (red supply zone).
Until ETH reclaims this zone with strength and volume, upside is capped.
🧭 Summary: Short-Term Bearish
Trend: Bearish (2H shows weakness; consistent lower highs/lows)
Momentum: Fading, with sellers in control
Volume: Increased on recent red candles → indicates pressure
💡 Should You Hold or Sell? Short-Term Traders (2H-1D):
⚠️ Consider waiting or trimming positions if you're leveraged or seeking short-term profit.
A better re-entry might come near $2,200 or even $1,750 if sell pressure increases.
-------------------------
Not for financial advise.
Not for recommendations to buy sell any crypto, security , or stocks.
Do your own research
Disclaimer
The information and publications are not meant to be, and do not constitute, financial, investment, trading, or other types of advice or recommendations supplied or endorsed by TradingView. Read more in the Terms of Use.
Disclaimer
The information and publications are not meant to be, and do not constitute, financial, investment, trading, or other types of advice or recommendations supplied or endorsed by TradingView. Read more in the Terms of Use.