analysis the chart
Let’s analyze the provided Ethereum (ETH/USD) chart on a daily timeframe from TradingView, focusing on the key technical elements and trends:
1. Overall Trend
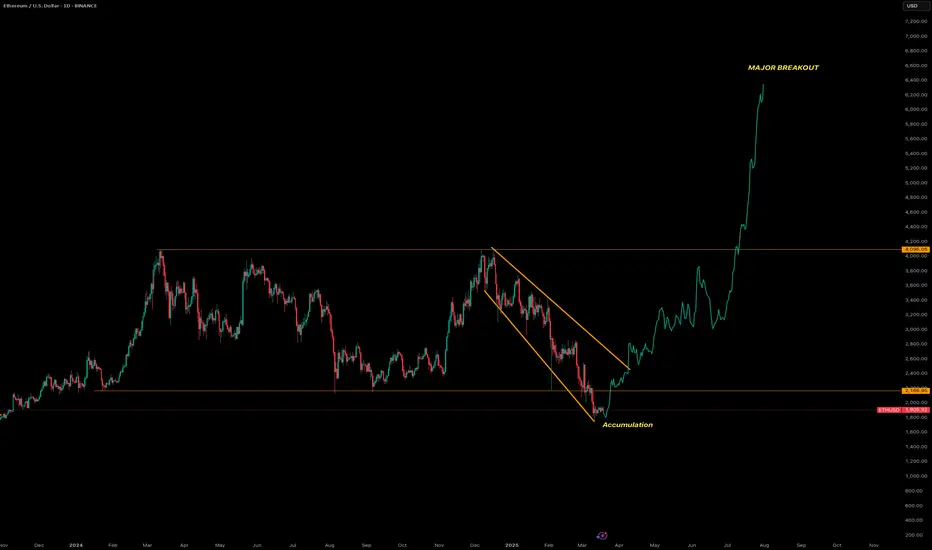
The chart displays a significant bullish trend for Ethereum, with the price rising from around $2,200 in early 2024 to approximately $4,000 as of the latest data point (March 18, 2025).
The upward movement is marked by a sharp breakout, indicating a strong shift in momentum from consolidation to a rapid ascent.
2. Price Levels and Targets
Current Price: Approximately $4,000, with a previous support/resistance zone around $2,200.
The chart highlights a major breakout above the descending triangle pattern, suggesting potential for further upside, though no specific price target is explicitly labeled beyond the current level.
3. Technical Patterns
Descending Triangle: The chart features a descending triangle pattern, typically considered a bearish continuation pattern. However, the recent price action has broken out upward through the upper resistance line (around $2,200-$2,500), invalidating the bearish outlook and turning it into a bullish reversal signal.
Accumulation Phase: A clear accumulation zone is marked near the lower boundary of the triangle (around $2,200), where the price consolidated before the breakout. This suggests strong buying interest built up at this level, supporting the subsequent rally.
4. Support and Resistance
Support: The $2,200 level, which acted as the lower boundary of the triangle, now serves as a potential support zone if the price pulls back. This level could be retested as new support following the breakout.
Resistance: The next resistance is not explicitly marked, but the rapid upward move suggests the price may face selling pressure around previous highs (e.g., $4,500-$5,000) or psychological levels like $5,000, based on Ethereum’s historical behavior.
5. Volume and Momentum
Volume data isn’t shown, but the steep upward slope post-breakout indicates significant buying pressure and momentum. A breakout with high volume would further confirm the strength of this move.
6. Timeframe and Projection
The chart spans from late 2023 to mid-2025, with the major breakout occurring around early 2025. The sharp rise suggests this bullish momentum could continue in the short to medium term, potentially pushing Ethereum toward new all-time highs (above $4,800, its previous peak).
7. Key Observations
The upward breakout from the descending triangle is a powerful bullish signal, often indicating a reversal of prior bearish pressure and the start of a new uptrend.
The accumulation phase near $2,200 reflects a period where buyers absorbed selling pressure, setting the stage for the breakout.
Potential risks include a pullback to retest the broken resistance (now support) at $2,200-$2,500, or overextension if the rally lacks consolidation. Monitoring for overbought conditions (e.g., via RSI or other indicators) could be prudent.
Let’s analyze the provided Ethereum (ETH/USD) chart on a daily timeframe from TradingView, focusing on the key technical elements and trends:
1. Overall Trend
The chart displays a significant bullish trend for Ethereum, with the price rising from around $2,200 in early 2024 to approximately $4,000 as of the latest data point (March 18, 2025).
The upward movement is marked by a sharp breakout, indicating a strong shift in momentum from consolidation to a rapid ascent.
2. Price Levels and Targets
Current Price: Approximately $4,000, with a previous support/resistance zone around $2,200.
The chart highlights a major breakout above the descending triangle pattern, suggesting potential for further upside, though no specific price target is explicitly labeled beyond the current level.
3. Technical Patterns
Descending Triangle: The chart features a descending triangle pattern, typically considered a bearish continuation pattern. However, the recent price action has broken out upward through the upper resistance line (around $2,200-$2,500), invalidating the bearish outlook and turning it into a bullish reversal signal.
Accumulation Phase: A clear accumulation zone is marked near the lower boundary of the triangle (around $2,200), where the price consolidated before the breakout. This suggests strong buying interest built up at this level, supporting the subsequent rally.
4. Support and Resistance
Support: The $2,200 level, which acted as the lower boundary of the triangle, now serves as a potential support zone if the price pulls back. This level could be retested as new support following the breakout.
Resistance: The next resistance is not explicitly marked, but the rapid upward move suggests the price may face selling pressure around previous highs (e.g., $4,500-$5,000) or psychological levels like $5,000, based on Ethereum’s historical behavior.
5. Volume and Momentum
Volume data isn’t shown, but the steep upward slope post-breakout indicates significant buying pressure and momentum. A breakout with high volume would further confirm the strength of this move.
6. Timeframe and Projection
The chart spans from late 2023 to mid-2025, with the major breakout occurring around early 2025. The sharp rise suggests this bullish momentum could continue in the short to medium term, potentially pushing Ethereum toward new all-time highs (above $4,800, its previous peak).
7. Key Observations
The upward breakout from the descending triangle is a powerful bullish signal, often indicating a reversal of prior bearish pressure and the start of a new uptrend.
The accumulation phase near $2,200 reflects a period where buyers absorbed selling pressure, setting the stage for the breakout.
Potential risks include a pullback to retest the broken resistance (now support) at $2,200-$2,500, or overextension if the rally lacks consolidation. Monitoring for overbought conditions (e.g., via RSI or other indicators) could be prudent.
Trade active
Note
2000$ Disclaimer
The information and publications are not meant to be, and do not constitute, financial, investment, trading, or other types of advice or recommendations supplied or endorsed by TradingView. Read more in the Terms of Use.
Disclaimer
The information and publications are not meant to be, and do not constitute, financial, investment, trading, or other types of advice or recommendations supplied or endorsed by TradingView. Read more in the Terms of Use.