ETH/USD Analysis – Rising Wedge Breakdown Indicates Bearish Momentum
🧠 Chart Pattern Breakdown – Rising Wedge
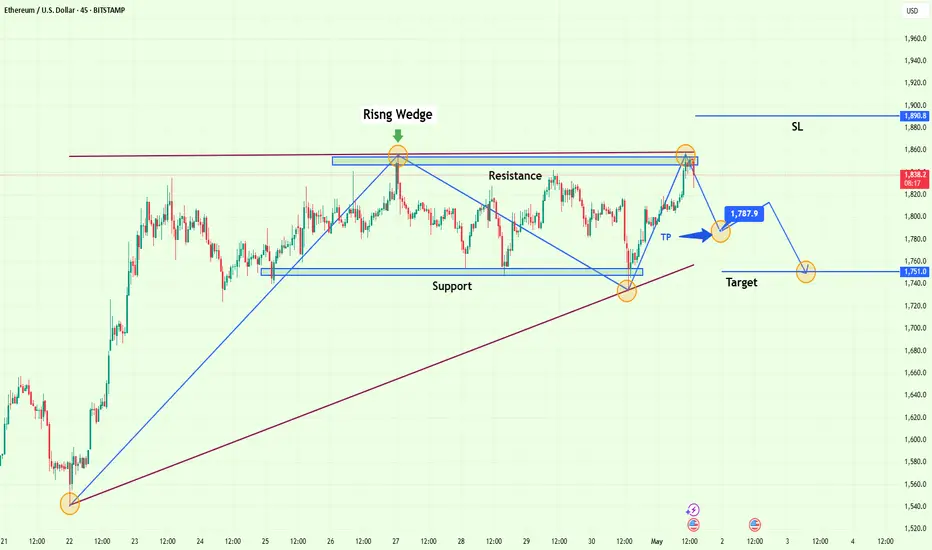
This Ethereum to USD chart on the 45-minute timeframe clearly illustrates the formation of a Rising Wedge pattern, a well-documented bearish reversal structure. This pattern is often seen at the end of an uptrend or after a corrective move, indicating that buying pressure is losing strength as price compresses into a narrowing range.
Formation Start: The rising wedge began forming after a strong bullish leg starting around April 22nd.
Structure: The price formed higher highs and higher lows, bounded by two converging upward trendlines.
Volume Behavior: Though not shown here, rising wedges often see declining volume, which supports the hypothesis of weakening bullish conviction.
Once price tested the upper boundary of the wedge near $1,850, rejection occurred and the wedge was broken to the downside — confirming the bearish setup.
📍 Key Technical Levels
Resistance Zone ($1,850–$1,860):
This horizontal resistance level was tested multiple times but failed to break. A strong reversal candle near this zone marks it as a critical supply area.
Support Zone ($1,751):
This is a historically tested demand zone where previous price action has rebounded. This makes it a highly likely short-term target for bears.
Intermediate Support (TP1 at $1,787.9):
Minor structure and a diagonal trendline intersect here. A logical point for a partial exit or re-evaluation.
Stop Loss (SL at $1,890.8):
Placed well above the recent highs and wedge structure, protecting against false breakouts or sudden bullish reversals.
💡 Trade Strategy: Short Setup
With the wedge break and rejection from resistance, the setup favors a short trade:
Entry: Near the breakdown zone around $1,830–$1,845
TP1 (Take Profit 1): $1,787.9 – trendline and recent structure low
TP2 (Final Target): $1,751.0 – major horizontal support
SL (Stop Loss): $1,890.8 – invalidation zone above resistance
This offers a favorable Risk-to-Reward Ratio (~2.5:1).
📉 Market Psychology Behind the Setup
As Ethereum pushed higher within the wedge, buyers began to exhaust due to narrowing price swings.
The inability to push beyond resistance at $1,860 indicates a strong presence of institutional sellers or profit-takers.
The breakdown signals a shift in momentum where sellers now control the short-term price action.
Traders exiting long positions at the wedge breakdown further add to selling pressure.
🔁 Alternative Scenarios to Watch
Bullish Reversal: If ETH reclaims $1,860 with strong momentum and closes above the wedge top, the bearish outlook would be invalidated.
Consolidation: Price could range between $1,787 and $1,830 before deciding on further direction.
Trend Continuation: A clean break below $1,751 may lead to continuation toward $1,700 or even lower zones.
📌 Summary of the ETH/USD Trading Setup
Element Value
Pattern Rising Wedge
Direction Bearish
Entry Zone ~$1,830–$1,845
TP1 $1,787.9
TP2 $1,751.0
SL $1,890.8
Risk/Reward Approx. 2.5:1
Timeframe 45-min (Short-Term)
Confidence High (Pattern + Resistance Rejection + Trendline Break)
🚨 Final Note
This is a textbook bearish wedge breakdown paired with key resistance rejection. Traders should remain cautious of volatility near the support zone and manage their position with discipline. This setup offers both clarity and control — a great opportunity for traders favoring structured entries with defined exits.
🧠 Chart Pattern Breakdown – Rising Wedge
This Ethereum to USD chart on the 45-minute timeframe clearly illustrates the formation of a Rising Wedge pattern, a well-documented bearish reversal structure. This pattern is often seen at the end of an uptrend or after a corrective move, indicating that buying pressure is losing strength as price compresses into a narrowing range.
Formation Start: The rising wedge began forming after a strong bullish leg starting around April 22nd.
Structure: The price formed higher highs and higher lows, bounded by two converging upward trendlines.
Volume Behavior: Though not shown here, rising wedges often see declining volume, which supports the hypothesis of weakening bullish conviction.
Once price tested the upper boundary of the wedge near $1,850, rejection occurred and the wedge was broken to the downside — confirming the bearish setup.
📍 Key Technical Levels
Resistance Zone ($1,850–$1,860):
This horizontal resistance level was tested multiple times but failed to break. A strong reversal candle near this zone marks it as a critical supply area.
Support Zone ($1,751):
This is a historically tested demand zone where previous price action has rebounded. This makes it a highly likely short-term target for bears.
Intermediate Support (TP1 at $1,787.9):
Minor structure and a diagonal trendline intersect here. A logical point for a partial exit or re-evaluation.
Stop Loss (SL at $1,890.8):
Placed well above the recent highs and wedge structure, protecting against false breakouts or sudden bullish reversals.
💡 Trade Strategy: Short Setup
With the wedge break and rejection from resistance, the setup favors a short trade:
Entry: Near the breakdown zone around $1,830–$1,845
TP1 (Take Profit 1): $1,787.9 – trendline and recent structure low
TP2 (Final Target): $1,751.0 – major horizontal support
SL (Stop Loss): $1,890.8 – invalidation zone above resistance
This offers a favorable Risk-to-Reward Ratio (~2.5:1).
📉 Market Psychology Behind the Setup
As Ethereum pushed higher within the wedge, buyers began to exhaust due to narrowing price swings.
The inability to push beyond resistance at $1,860 indicates a strong presence of institutional sellers or profit-takers.
The breakdown signals a shift in momentum where sellers now control the short-term price action.
Traders exiting long positions at the wedge breakdown further add to selling pressure.
🔁 Alternative Scenarios to Watch
Bullish Reversal: If ETH reclaims $1,860 with strong momentum and closes above the wedge top, the bearish outlook would be invalidated.
Consolidation: Price could range between $1,787 and $1,830 before deciding on further direction.
Trend Continuation: A clean break below $1,751 may lead to continuation toward $1,700 or even lower zones.
📌 Summary of the ETH/USD Trading Setup
Element Value
Pattern Rising Wedge
Direction Bearish
Entry Zone ~$1,830–$1,845
TP1 $1,787.9
TP2 $1,751.0
SL $1,890.8
Risk/Reward Approx. 2.5:1
Timeframe 45-min (Short-Term)
Confidence High (Pattern + Resistance Rejection + Trendline Break)
🚨 Final Note
This is a textbook bearish wedge breakdown paired with key resistance rejection. Traders should remain cautious of volatility near the support zone and manage their position with discipline. This setup offers both clarity and control — a great opportunity for traders favoring structured entries with defined exits.
Related publications
Disclaimer
The information and publications are not meant to be, and do not constitute, financial, investment, trading, or other types of advice or recommendations supplied or endorsed by TradingView. Read more in the Terms of Use.
Related publications
Disclaimer
The information and publications are not meant to be, and do not constitute, financial, investment, trading, or other types of advice or recommendations supplied or endorsed by TradingView. Read more in the Terms of Use.