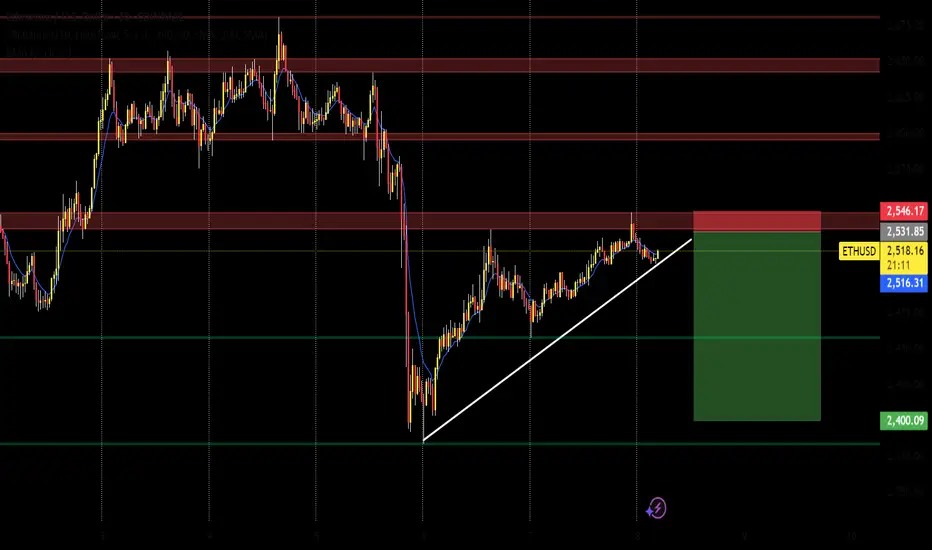
Price is testing a major resistance zone (2531–2546) after a short-term uptrend. A rejection here could trigger a move down to the 2400 support area. Clean risk-reward with SL above resistance. Confirmation needed – watch for trendline break or bearish candle pattern.
Asset: ETH/USD
Trend Bias: Bearish (based on the setup)
Chart Structure:
Price is approaching a resistance zone around 2531–2546 (marked in red).
Ascending trendline (white) indicates recent bullish momentum.
Short position is being considered right at/near the resistance level.
📉 Trade Setup (Short):
Entry Zone: Around 2531.85–2546.17
Stop Loss (SL): Above 2546.17
Take Profit (TP): Around 2400.09
Risk-Reward Ratio: Roughly 1:3, which is favorable.
📌 Supporting Signals:
Price is testing a supply zone/resistance block.
EMA is flattening, showing momentum slowing.
Previous sharp drop from this zone shows strong seller presence.
Trendline break could confirm bearish entry.
🛑 Caution:
If price breaks above 2546, setup is invalid.
Watch for confirmation (e.g., bearish engulfing or break of trendline) before entering.
Follow Me
Get Accurate Forex & Gold Signals Daily!
Join our trusted trading team with real-time insights and expert support.
Start your winning journey now
Join our trusted trading team with real-time insights and expert support.
Start your winning journey now
Disclaimer
The information and publications are not meant to be, and do not constitute, financial, investment, trading, or other types of advice or recommendations supplied or endorsed by TradingView. Read more in the Terms of Use.