Ethereum Monthly Chart Analysis | Cup and Handle Formation
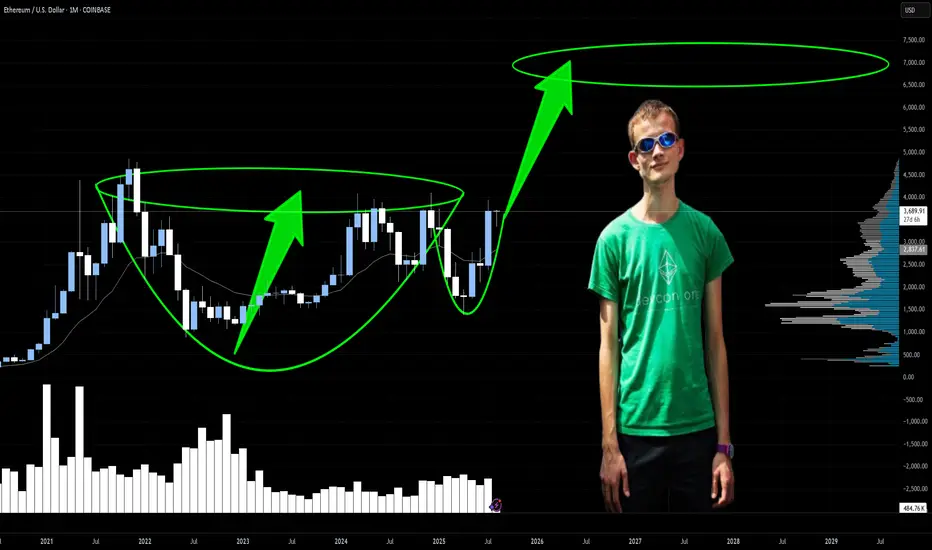
Ethereum appears to be forming a classic Cup and Handle pattern on its monthly chart
a bullish technical setup that typically precedes a significant price breakout. This pattern has been developing gradually since ETH's all-time high in November 2021, when it peaked near $4,800.
Over the past two years, ETH has slowly recovered, rounding out the right side of the cup. By mid 2025, ETH was trading near the key resistance zone of $3,800–4,000, aligning with the prior support zone from late 2021. This completes the cup portion of the pattern. In August 2025, ETH began pulling back by approx 15–20%, signaling the potential formation of the handle, a typical short term consolidation before a breakout
Breakout Potential and Price Target
The depth of the cup from $4,800 (resistance) down to $880 (support) is roughly $3,920. According to traditional Cup and Handle theory, once ETH breaks above the neckline resistance ($4,000), the expected upside target is calculated by adding this depth to the breakout level:
Breakout Target = $4,000 + $3,920 = $7,920 which is make sense
so next targets are 3800, 3900 and 4100$ for now
Also SharpLink Gaming and BLACK ROCK load every dip so far and
most big alts hit their ATH so now its ETH show time
🟣MasterClass moonypto.com/masterclass
🟢Signal moonypto.com/signal
🔵News t.me/moonypto
⚪ t.me/moonyptofarsi
🟢Signal moonypto.com/signal
🔵News t.me/moonypto
⚪ t.me/moonyptofarsi
Related publications
Disclaimer
The information and publications are not meant to be, and do not constitute, financial, investment, trading, or other types of advice or recommendations supplied or endorsed by TradingView. Read more in the Terms of Use.